Free Access
Fig. A.2
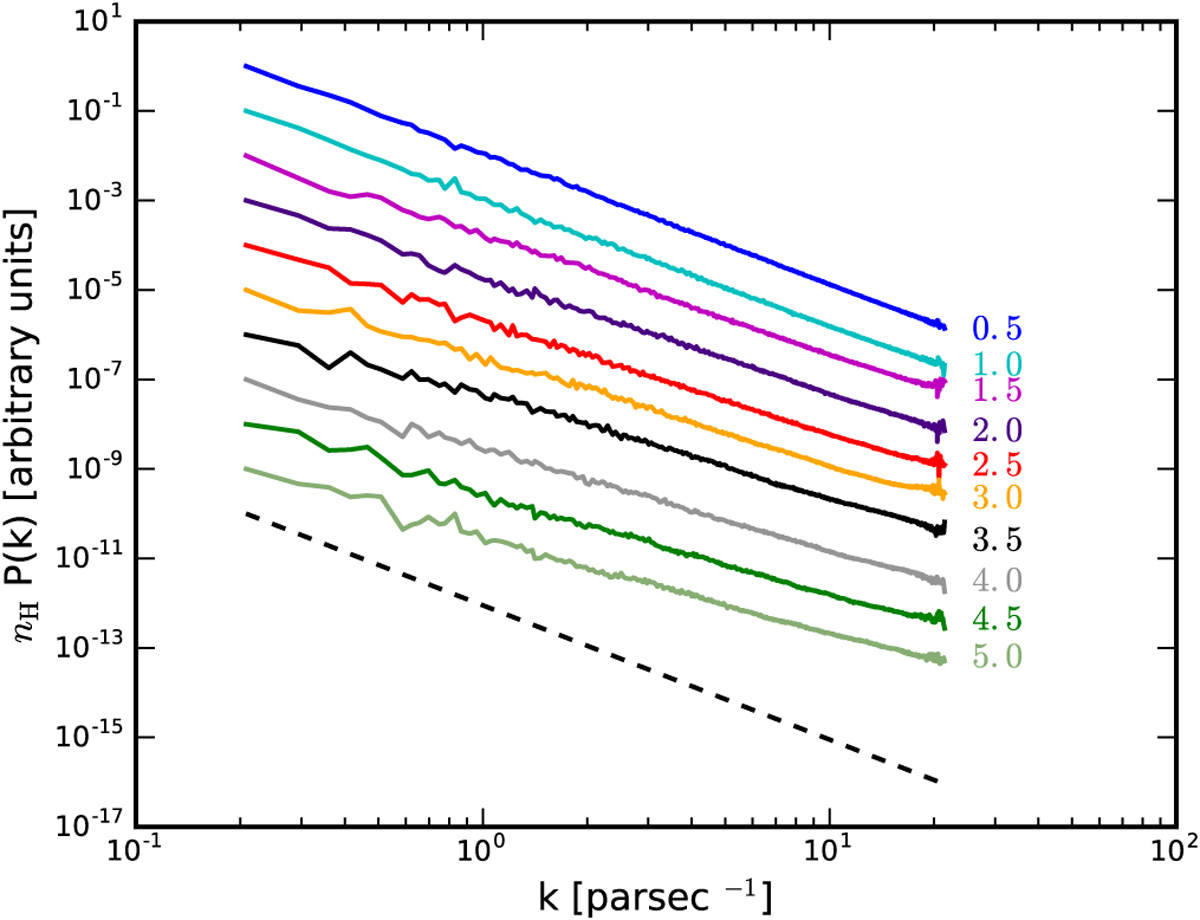
Power spectra ![]() of synthetic nH fields obtained by exponentiation of a 120 × 120 × 120 pixels fractional Brownian motion with spectral index βX = 3. The fluctuation levels yn are specified next to each curve, and the original field’s power spectrum
of synthetic nH fields obtained by exponentiation of a 120 × 120 × 120 pixels fractional Brownian motion with spectral index βX = 3. The fluctuation levels yn are specified next to each curve, and the original field’s power spectrum ![]() is represented as a dashed line.
is represented as a dashed line.
Current usage metrics show cumulative count of Article Views (full-text article views including HTML views, PDF and ePub downloads, according to the available data) and Abstracts Views on Vision4Press platform.
Data correspond to usage on the plateform after 2015. The current usage metrics is available 48-96 hours after online publication and is updated daily on week days.
Initial download of the metrics may take a while.