Fig. 12
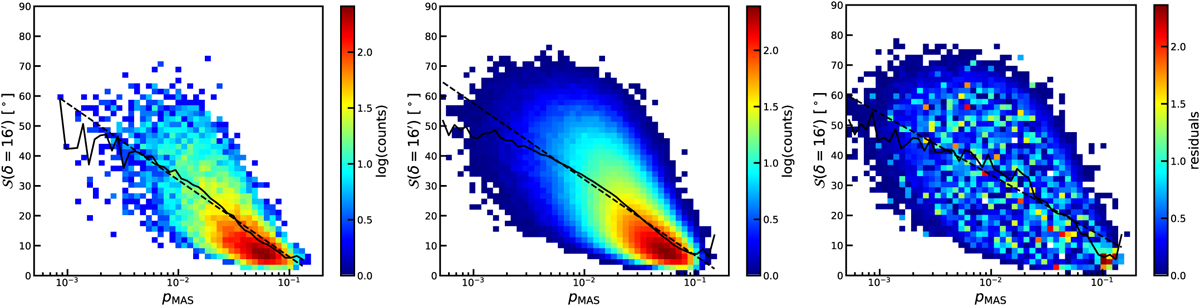
Two-dimensional distribution function of ![]() and polarization fraction pMAS for the Polaris Flare maps (left), for the model maps using the best fitting parameters averaged over 60 realizations (middle), and residuals (right). The polarization angle dispersion function
and polarization fraction pMAS for the Polaris Flare maps (left), for the model maps using the best fitting parameters averaged over 60 realizations (middle), and residuals (right). The polarization angle dispersion function ![]() is computed at a lag δ = 16′. The solid black line shows the mean
is computed at a lag δ = 16′. The solid black line shows the mean ![]() for each bin in pMAS
and the dashed black line is a linear fit of that curve, restricted to bins in
pMAS which contain at least 1% of the total number of points (120 × 120).
for each bin in pMAS
and the dashed black line is a linear fit of that curve, restricted to bins in
pMAS which contain at least 1% of the total number of points (120 × 120).
Current usage metrics show cumulative count of Article Views (full-text article views including HTML views, PDF and ePub downloads, according to the available data) and Abstracts Views on Vision4Press platform.
Data correspond to usage on the plateform after 2015. The current usage metrics is available 48-96 hours after online publication and is updated daily on week days.
Initial download of the metrics may take a while.