Fig. 10
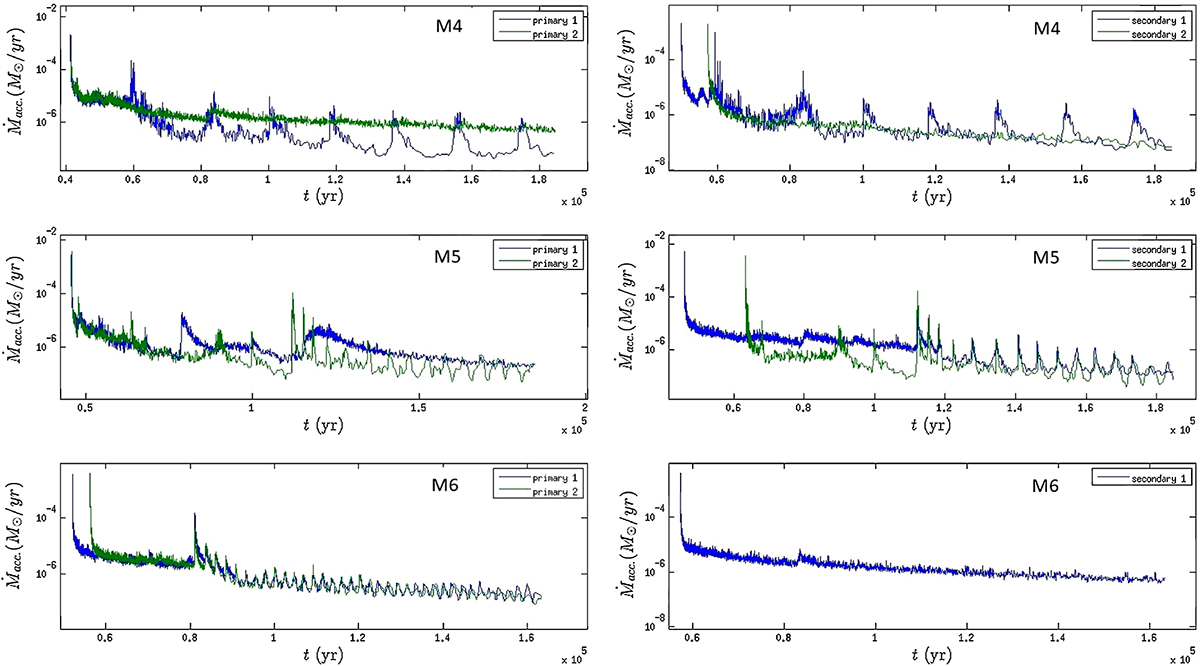
Evolution of the mass accretion rate of the individual protostellar embryos during the evolution of models M4–M6. In model M4 the binary is primary 1 and secondary 1. In model M5 the binaries are primary 1 and primary 2 along with secondary 1 and secondary 2. In model M6 the binary is primary 1 and primary 2. The accretion rates for primary protostars and secondary protostars of each model are shown in the left and right panels, respectively. The accretion rate for each protostar is shown in units of log of solar mass per year. The time is indicated in years. The first spike for each appearing sink in all panels represents the formation of a protostar, which is followed by subsequent accretion bursts.
Current usage metrics show cumulative count of Article Views (full-text article views including HTML views, PDF and ePub downloads, according to the available data) and Abstracts Views on Vision4Press platform.
Data correspond to usage on the plateform after 2015. The current usage metrics is available 48-96 hours after online publication and is updated daily on week days.
Initial download of the metrics may take a while.