| Issue |
A&A
Volume 614, June 2018
|
|
|---|---|---|
| Article Number | A13 | |
| Number of page(s) | 11 | |
| Section | Cosmology (including clusters of galaxies) | |
| DOI | https://doi.org/10.1051/0004-6361/201731990 | |
| Published online | 06 June 2018 | |
Constraints from thermal Sunyaev-Zel’dovich cluster counts and power spectrum combined with CMB
Institut d’Astrophysique Spatiale, CNRS (UMR 8617) Université Paris-Sud,
Bâtiment 121,
Orsay,
France
e-mail: This email address is being protected from spambots. You need JavaScript enabled to view it.
Received:
24
September
2017
Accepted:
18
December
2017
Abstract
The thermal Sunyaev-Zel’dovich (tSZ) effect is one of the recent probes of cosmology and large-scale structures. We update constraints on cosmological parameters from galaxy clusters observed by the Planck satellite in a first attempt to combine cluster number counts and the power spectrum of hot gas; we used a new value of the optical depth and, at the same time, sampling on cosmological and scaling-relation parameters. We find that in the ΛCDM model, the addition of a tSZ power spectrum provides small improvements with respect to number counts alone, leading to the 68% c.l. constraints Ωm = 0.32 ± 0.02, σ8 = 0.76 ± 0.03, and σ8(Ωm/0.3)1/3 = 0.78 ± 0.03 and lowering the discrepancy with results for cosmic microwave background (CMB) primary anisotropies (updated with the new value of τ) to ≃1.8σ on σ8. We analysed extensions to the standard model, considering the effect of massive neutrinos and varying the equation of state parameter for dark energy. In the first case, we find that the addition of the tSZ power spectrum helps in improving cosmological constraints with respect to number count alone results, leading to the 95% upper limit ∑ mν < 1.88 eV. For the varying dark energy equation of state scenario, we find no important improvements when adding tSZ power spectrum, but still the combination of tSZ probes is able to provide constraints, producing w = −1.0 ± 0.2. In all cosmological scenarios, the mass bias to reconcile CMB and tSZ probes remains low at (1 − b) ≲ 0.67 as compared to estimates from weak lensing and X-ray mass estimate comparisons or numerical simulations.
Key words: cosmological parameters / large-scale structure of Universe / galaxies: clusters: general
© ESO 2018
1 Introduction
Galaxy clusters are the most massive bound structures emerging in the cosmic web of large-scale structure (LSS). These objects are associated with peaks in the matter density field on megaparsec scales. The abundance of clusters is strongly sensitive to both growth of structure and matter density, depends on the underlying cosmological model, and thus provides constraints on cosmological parameters; see e.g. Allen et al. (2011).
These constraints are even more powerful when combined with, or compared to, results from other observables; in particular primary temperature and polarization anisotropies of the cosmic microwave background (CMB) radiation and baryon acoustic oscillations (BAO). On the one hand, comparing results from various observables provides important consistency checks. On the other hand, the combination of geometrical and growth-based probes can improve constraints on parameters such as the equation of state (EoS) for dark energy owing to the different degeneracies between parameters for the different probes.
Galaxy clusters are made by dark matter and baryons in different phases that can be probed by observations at different wavelengths; see again Allen et al. (2011). In recent years, several measurements of cluster samples in the X-rays (Boehringer et al. 2017; Chon & Boehringer 2012), optical (Rykoff et al. 2016), and millimetre (mm; Bleem et al. 2015, South Pole Telescope; SPT), (Marriage et al. 2011, Atacama Cosmology Telescope; ACT), (Planck Collaboration XXIX 2014; Planck Collaboration XXVI 2016, Planck) wavelengths have improved the constraints on cosmological parameters.
In this work, we focus on galaxy clusters observed in mm wavelengths through the thermal Sunyaev-Zel’dovich (tSZ) effect (Sunyaev & Zeldovich 1970), that is the inverse Compton scattering between CMB photons and hot electrons in the intra-cluster medium (ICM) using measurements of the Planck satellite (Planck Collaboration I 2016; Planck Collaboration XXVI 2016). In particular, we exploit the combination of galaxy cluster number counts and the angular power spectrum of warm-hot gas seen in SZ by Planck (Planck Collaboration XXII 2016) and SPT (George et al. 2015). We try to quantify if and how the addition of current tSZ power spectrum data helps to better break the degeneracy between the cosmological parameters and those used to model the physics of the clusters.
In light of the discrepancy between CMB and number counts constraints (Planck Collaboration XX 2014), we compare our results with most recent CMB data from Planck Collaboration XI (2016); Planck Collaboration Int. XLVI (2016) for the Λ cold dark matter (CDM) model. We also explore results obtained by relaxing some assumptions of the standard model, in particular considering the sum of the neutrino masses, ∑ mν, and the dark energy EoS parameter, w, as varying parameters. We show how our combined analysis improves constraints on these extensions of the standard model.
This paper is organized as follows: In Sect. 2 we briefly describe the theoretical model needed to build the number counts for galaxy clusters observed through the tSZ effect and the model for the tSZ power spectrum. In Sect. 3 we describe the approach we use in this analysis and in Sect. 4 we show our results. In Sects. 5 and 6 we derive our final discussion and conclusions.
2 tSZ cosmological probes
The tSZ effect is a powerful cosmological probe. The main property of this effect is the fact that its surface brightness is redshift independent, therefore providing nearly mass-limited cluster samples from high-resolution mm surveys at arbitrarily high redshift. The ability to sample up to high redshifts ensures that we can track with high accuracy the evolution of LSS; in particular this enables us to constrain neutrino mass owing to its effect on the evolution of LSS, i.e. the damping of matter power spectrum at small scales;see e.g. Lesgourgues & Pastor (2012).
The intensity of the tSZ effect, in a given direction of the sky  , is measured through the thermal Compton parameter y, defined as
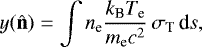 (1)
(1)
where kB is the Boltzmann constant, σT is the Thomson scattering cross section, and me, ne, and Te are the electron mass, number density, and temperature, respectively.
To define clusters detected through the tSZ effect, we adopt the following convention: the cluster mass M500 is the total mass contained in a sphere of radius R500, which is defined as the radius within which the cluster mean mass overdensity is 500 times the critical density at that redshift, i.e.
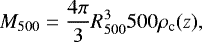 (2)
(2)
where the critical density is defined as
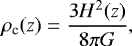 (3)
(3)
and H(z) is the Hubble parameter.
We consider therefore the following observables for clusters detection from Planck Collaboration XXVI (2016): Y 500, which is the Compton y-profile integrated within a sphere of radius, R500, and the cluster angular size, θ500.
2.1 Number counts
The predicted number of clusters observed by a given survey in a redshift bin [zi, zi+1] is given by
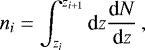 (4)
(4)
where
 (5)
(5)
where  is the survey completeness at a given position in the sky (l, b) and
 (6)
(6)
is the product between the comoving volume element (per unit redshift and solid angle) d V c ∕dzdΩ and the mass function d N(M500, z)∕dM500. The latter represents the probability of having a galaxy cluster of mass M at redshift z, per unit volume, in the direction given by dΩ.
This description can be generalized to define number counts as functions of the signal-to-noise ratio (S/N) as well; see (Planck Collaboration XXIV 2016).
2.2 tSZ power spectrum
The complete analytical description of tSZ power spectrum has been fully covered in different papers, such as Komatsu & Seljak (2002) and Planck Collaboration XXI (2014); therefore we only report the necessary results.
Considering the halo-model (see e.g. Cooray 2000), we can write tSZ power spectrum as the sum of one-halo and two-halo terms,
 (7)
(7)
In the flat sky limit (ℓ ≫ 1), the one-halo term is expressed as
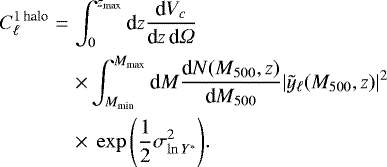 (8)
(8)
The term ỹℓ(M500, z) is the Fourier transform on the sphere of the Compton parameter y of individual clusters and is given by (using Limber approximation)
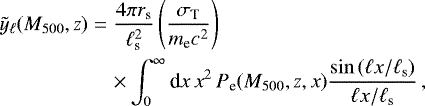 (9)
(9)
where rs is the scale radius of the three-dimensional pressure profile, Pe(M500, z, x), ℓs = DA(z)∕rs (where DA (z) is the angular diameter distance) and x = r∕rs. We use the universal pressure profile provided by Arnaud et al. (2010). The term  represents the dispersion in the scaling relations that is fully described in the next section.
The two-halo term (Komatsu & Kitayama 1999) is derived from computing the correlation between two different halos as
![Mathematical equation: \begin{eqnarray*}C_{\ell} ^{2\, \text{halo}} &=& \int _0 ^{z_{\text{max}}} \textrm{d}z \dfrac{\textrm{d}V_c}{\textrm{d}z\, \textrm{d}{\Omega}} \notag \\ && \times~\left[ \int _{M_{\text{min}}} ^{M_{\text{max}}} \textrm{d}M \dfrac{\textrm{d}N(M_{500},z)}{\textrm{d}M_{500}} \tilde{y}_{\ell}(M_{500},z) B(M_{500},z) \right] ^2 \notag \\ && \times~P(k,z), \end{eqnarray*}](/articles/aa/full_html/2018/06/aa31990-17/aa31990-17-eq14.png) (10)
(10)
where P(k, z) is the matter power spectrum and B(M, z) is the time-dependent linear bias factor. This last term relates the matter power spectrum to the power spectrum of the cluster correlation function. We follow Komatsu & Kitayama (1999) and use the definition
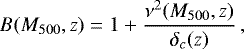 (11)
(11)
where ν(M500, z) = δc(M500)∕D(z)σ(M500) and σ(M500) is the present-day rms mass fluctuation, D(z) the linear growth factor, and δc(z) the threshold over-density of spherical collapse.
Following the analysis of Komatsu & Seljak (2002) and Horowitz & Seljak (2017), to evaluate our errors accurately, we also take into account the contribution from the trispectrum term,  , which is the harmonic-space four-point function and represents the non-Gaussian contribution of the cosmic variance. The dominant term in the halo model is defined as (Cooray 2001; Komatsu & Seljak 2002)
![Mathematical equation: \begin{eqnarray*}T_{\ell \ell'} & \simeq & \int _0 ^{z_{\text{max}}} \textrm{d}z \dfrac{\textrm{d}V_c}{\textrm{d}z \textrm{d}{\Omega}} \notag \\ && \times~\int _{M_{\text{min}}} ^{M_{\text{max}}} \textrm{d}M \left[ \dfrac{\textrm{d}N(M_{500},z)}{\textrm{d}M_{500}} \right. \notag \\ && \times~\tilde{y}_{\ell}(M_{500},z)|^2 |\tilde{y}_{\ell'}(M_{500},z)|^2 \biggr]. \end{eqnarray*}](/articles/aa/full_html/2018/06/aa31990-17/aa31990-17-eq17.png) (12)
(12)
2.3 Assumptions on the modelling ingredients
There are some major uncertainties in constraining cosmological parameters from galaxy clusters that are related to the ingredients needed to build the theoretical model described in the previous section. In fact the theoretical mass function needs to be transformed into a prediction of the distribution of clusters in the parameter space of survey observables. The first uncertainty is therefore related to an imperfect knowledge of the scaling relations between the cluster mass and the survey observable, that is used as a proxy for this quantity. The second uncertainty is related to the model of the selection process, which needs to be accurately built, to avoid possible selection biases that could affect final results on cosmological parameters constraints.
Thus, we must make some assumptions on scaling relations, mass function, and selection function to completely determine the theoretical model. Regarding the latter, it is out of the scope of this paper, we therefore refer to the complete discussion reported in Planck Collaboration XXIV (2016).
2.3.1 Scaling relations
A crucial element in modelling the cosmological probes is the exact evaluation of clusters mass and therefore of the scaling relations between survey observables and mass. For all details on the evaluation of these relations for the Planck observables, we refer to Planck Collaboration XX (2014) and we report only the final formulas for the integrated Compton y-profile, Y 500,
![Mathematical equation: \begin{equation*}E^{-\beta} (z) \left[ \dfrac{D_A^2 (z) Y_{500}}{10^{-4} \, \text{Mpc}^2} \right] = Y_* \left[ \dfrac{h}{0.7}\right] ^{-2 + \alpha} \left[ \dfrac{(1-b) M_{500}}{6 \cdot 10^{14}~M_{\odot}} \right] ^{\alpha}\, , \end{equation*}](/articles/aa/full_html/2018/06/aa31990-17/aa31990-17-eq18.png) (13)
(13)
and for the cluster angular size
![Mathematical equation: \begin{equation*}\theta_{500} = \theta _* \left[ \dfrac{h}{0.7}\right] ^{-2/3} \left[ \dfrac{(1-b) M_{500}}{3 \cdot 10^{14}~M_{\odot}} \right]^{1/3} E^{-2/3} (z) \left[ \dfrac{D_A(z)}{500 \, \text{Mpc}}\right] ^{-1} \, . \end{equation*}](/articles/aa/full_html/2018/06/aa31990-17/aa31990-17-eq19.png) (14)
(14)
In Eqs. (13) and (14) DA(z) is again the angular diameter distance, h is the reduced Hubble constant, H0∕100, and E(z) = H(z)∕H0. For the coefficients we follow what is reported in Planck Collaboration XXIV (2016) and consider θ* = 6.997 arcmin, β = 0.66 and for the others coefficients we use Gaussian distributed priors, reported in Table 1. Equation (13) is derived with a dispersion,  , given in Table 1. We consider it as a nuisance parameter for the counts only, since its effect on the power spectrum amplitude is negligible (lower than 1%). Therefore we neglect the last term in Eq. (8).
The quantity b is defined as the mass bias and it takes into account the difference between the cluster mass estimation, obtained assuming hydrostatic equilibrium, and the real cluster mass. By following the Planck Collaboration XXIV (2016) baseline, in this analysis we use a Gaussian distributed prior for (1 − b), from the Canadian Cluster Comparison Project (Hoekstra et al. 2015, labelled CCCP form now on), reported in Table 1. In Sect. 5, we discuss in detail the status of measurements and constraints on this quantity and its effects on the final results on cosmological parameters.
Priors on nuisance parameters for scaling relations, as defined in Planck Collaboration XXIV (2016).
2.3.2 Mass function
In order to evaluate the theoretical mass function, we rely on numerical N-body simulations. In particular, for our analysis we use the mass function provided by Tinker et al. (2008). Therefore, the number of halos per unit volume is given by
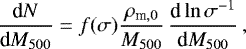 (15)
(15)
where ρm,0 is the matter density at redshift z = 0 and
![Mathematical equation: \begin{equation*}f(\sigma) = A \left[ 1 + \left( \dfrac{\sigma}{b}\right) ^{-a} \right] \exp{\left( -\dfrac{c}{\sigma ^2}\right)}. \end{equation*}](/articles/aa/full_html/2018/06/aa31990-17/aa31990-17-eq22.png) (16)
(16)
In Eqs. (15) and (16), σ is the standard deviation of density perturbations in a sphere of radius  , calculated in linear regime, and it is given by
 (17)
(17)
where W(kR) is the window function of a spherical top hat of radius R.
We evaluated the coefficients A, a, b, and c in Eq. (16) by interpolating the results provided by Tinker et al. (2008) at the required overdensity (i.e. 500 ρc(z)).
Different N-body simulations, but also different analyses (e.g. halo finder methods) produce various fitting formulas for the mass function. Planck Collaboration XXIV (2016) compared results on the cosmological parameters obtained with mass functions from Tinker et al. (2008) and Watson et al. (2013). Changing mass function does not change the accuracy in constraining cosmological parameters and it produces only a shift of ~1σ on the final constraints. We choose here to use the mass function from Tinker et al. (2008) since this is the most used in cluster analyses and since it offers direct comparison with Planck Collaboration XXIV (2016) for which this mass function was the baseline.
3 Method
In this work, we constrained the cosmological parameters from galaxy clusters, exploiting the combination of number counts and power spectrum. We considered the cluster sample provided by Planck Collaboration XXVI (2016), which consists of 439 clusters from the 65% cleanest part of the sky, above the S/N threshold of 6 and in the redshift range z = [0, 1]. In order to obtain the cluster number counts, we sampled on both redshift and S/N bins, as described in Planck Collaboration XXIV (2016). For the power spectrum, we used Planck estimates from Planck Collaboration XXII (2016) and an estimate of the angular power spectrum from SPT at ℓ = 3000 (George et al. 2015). We integrated in the redshift range z = [0, 3] and in the mass range M500 = [1013 h−1 M⊙, 5 × 10¹⁵ h−1 M⊙], following Planck Collaboration XXII (2016). In combining cluster number counts and tSZ power spectrum, we followed the analysis shown in Hurier & Lacasa (2017), who have found a low level of correlation between cluster number counts and tSZ power spectrum. This is due to varying contributions to the variance for the two probes, depending on the massrange. In particular, for the tSZ power spectrum the main contribution comes from massive halos (M500 > 105 M⊙), while for the number counts the main contribution comes from lower mass halos. This small overlap between the two galaxy cluster populations results in a small correlation. Therefore in our combination of tSZ cluster number counts and power spectrum, we decided to neglect any correlation between the two tSZ probes
We used a Monte Carlo Markov Chains (MCMC) approach to sample and constrain at the same time cosmological and scaling-relation parameters, which we consider as nuisance parameters in this analysis. When considering tSZ power spectrum data from Planck, we used the error bars already marginalized over the foreground and noise contributions (in particular clustered cosmic infrared background, radio point sources, infrared point sources, and correlated noise), as described in Planck Collaboration XXII (2016). We stress that even if SZ number counts and power spectrum show similar dependencies on cosmological parameters, they have different dependencies on scaling relations parameter α. We find  and
and  . Combining the two probes, we should therefore be able to reduce the degeneracy between nuisance and cosmological parameters.
For the present analysis, we used the November 2016 version of the publicly available package cosmomc (Lewis & Bridle 2002), relying on a convergence diagnostic based on Gelman and Rubin statistics. This version includes the cluster number-count likelihood for Planck (Planck Collaboration XXIV 2016). We modified this version to add the likelihood for the tSZ power spectrum (Planck Collaboration XXI 2014).
For the cosmological model, we first considered the ΛCDM model, varying the six standard parameters: the baryon and CDM densities, Ωb and Ωc; ratio of the sound horizon to the angular diameter distance at decoupling θ; scalar spectral index, ns; overall normalization of the spectrum, As at k = 0.05 Mpc−1; and reionization optical depth τ. We updated the results from Planck Collaboration XIII (2016) with the new value of the optical depth from Planck Collaboration Int. XLVI (2016); Planck Collaboration Int. XLVII (2016) by adding a Gaussian prior in our analysis, i.e. τ = 0.055 ± 0.009. We included in our analysis the four scaling parameters reported in Table 1, i.e. Y *, α, (1 −b), and  , only for number counts. Since SZ number counts and power spectrum are not able to constrain the basic six-parameters model alone, we also added BAO measurements from Anderson et al. (2014). We compared and combined our results with CMB primary temperature and polarisation anisotropy data from Planck Collaboration XIII (2016); we updated these results with the new optical depth reported above.
Finally, we explored results obtained by relaxing the assumptions of the standard model, i.e. allowing first the sum of neutrino masses ∑ mν and then the dark energy EoS parameter w to vary, and therefore added these to our analysis.
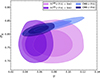 |
Fig. 1 Two-dimensional probability distributions for τ and σ8 for various values of optical depths (see text). We compare results for SZ number counts alone (pink and purple) and for CMB data alone (blue and light blue). |
4 Results
We report here our results, comparing constraints from tSZ power spectrum alone, tSZ number counts alone, and their combination. We compared these results with those obtained from CMB temperature and polarization anisotropy data and the complete combination of datasets (power spectrum, number counts, and CMB data). We stress that when considering tSZ probes, alone or in combination with CMB data, we always add BAO measurements as well. We analysed both the standard ΛCDM model and extensions to it.
We present results for cosmological parameters to which galaxy clusters are more sensitive, in particular the total matter density, Ωm, and the standard deviation of density perturbations, defined in Eq. (17), evaluated at radius R = 8 Mpc h−1, σ8.
4.1 ΛCDM model
We first show the effect of the new value of the optical depth. In Fig. 1, we compare two-dimensional probability distributions for τ and σ8 for tSZ number counts and CMB data, for the various values of τ. We find that while this change in the optical depth does not affect the constraining power of cluster number counts on σ8, the change modifies constraints from CMB, therefore reducing the discrepancy between the two different probes. The change in CMB constraints is due to the degeneracy between optical depth and σ8, that is the fact that small-scale CMB power spectrum is proportional to the quantity σ8 e−τ (see e.g. Planck Collaboration XVI 2014). The improved constraint on σ8 from CMB reduces the tension with SZ number counts from 2.4σ (Planck Collaboration XIII 2016) to 1.5σ.
We focus now on the results for σ8 and the matter density Ωm. We show the constraints from CMB temperature and polarization anisotropy data, from the tSZ power spectrum alone ( ), from tSZ number counts alone (NC tSZ), from the combination of the two tSZ probes (
 ), and finally those from the complete combination of all datasets (
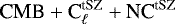 ), adding BAO data as well. We stress that from now on we always use the new prior for the optical depth and that results for
  are always obtained by combining Planck and SPT data. We present the results in Figs. 2, 3 and 4, we show the corresponding figure of merits (FoM) in Table 2 and we summarize the constraints (68% c.l.) in Table 3 for the various datasets.
When considering the combination of tSZ number counts and power spectrum, we note that the combination is driven by tSZ counts since tSZ spectrum shows weaker constraints; see comparison of the figure of merits for the various datasets in Table 2. We nevertheless obtain a small improvement on the Ωm and σ8 constraints, within 10% on individual error bars, and a small shift towards lower values of Ωm and σ8, within 0.2 and 0.3 σ. The slight differences in scaling-cosmological parameter degeneracies between the two tSZ probes drive this small improvement, as shown in Fig. 4. As for the comparison between constraints from the CMB and tSZ combined probes, we find a slightly larger discrepancy, of ≃1.8σ, than the case of the CMB vs tSZ counts alone.
We now focus on the scaling-relation parameters and in particular on the mass bias, which significantly affects the values of σ8. As noted in Planck Collaboration XX (2014); Planck Collaboration XXIV (2016), low values of mass bias lead to high values of σ8 (see also Fig. 4). We show in Fig. 3 the results from the tSZ combination probes, adding the CMB data, together with the CCCP-based prior considered in our analysis. In our updated analysis with the new optical depth, we find that results from the tSZ combined probes are driven by the prior distribution. Adding CMB data to the tSZ counts or to the combined tSZ probes drives the mass bias to lower values; in this case we do not add the BAO data in order to fully compare with results from Planck Collaboration XXIV (2016). On the one hand, we find that the bias needed to reconcile CMB constraints with those from the tSZ number counts is (1 −b) = 0.62 ± 0.07, which is comparable to the value (1 − b) = 0.58 ± 0.04 found in Planck Collaboration XXIV (2016). However, the bias increases to (1 −b) = 0.63 ± 0.04 when using the tSZ counts and power spectrum.
 |
Fig. 2 Two-dimensional probability distributions for Ωm and σ8 in the ΛCDM scenario, only power spectrum (grey), only number counts (orange), the combination of the two probes (green), only CMB (red), and the combination of all the probes (blue). |
Figures of merit (FoM) for tSZ spectrum alone, number counts alone, the combination of the two probes, and for Ωm and σ8 parameters in the ΛCDM scenario.
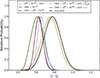 |
Fig. 3 One-dimensional probability distribution for the mass bias (1 − b) for various dataset combinations: the complete tSZ combination and BAO (orange); CMB and the complete tSZ combination (blue, almost completely overlapped by the red line); CMB and number counts (green); the combination of CMB and tSZ, adding the effect of massive neutrinos (light blue); and the combination of CMB and tSZ, adding the effect of varying the dark energy EoS parameter (red). All of these combinations are compared to the CCCP prior we used in our analysis (black). |
4.2 Extensions to ΛCDM
We now consider two extensions to the ΛCDM model: adding massive neutrinos and including the EoS of dark energy. For these extensions to the standard model, we explore whether the combination of the two tSZ probes can improve the constraints on cosmological and scaling-relation parameters with respect to only number counts. We compare these various results with constraints from only CMB and from the complete combinationof all datasets.
4.2.1 Massive neutrinos
For a given large-scale amplitude (constrained by CMB low multipoles), adding massive neutrinos damps the amplitude of matter power spectrum at small scales, which in turn lowers the value of σ8. We present in the left panel of Fig. 5 and in Table 4, the new constraints on Ωm and σ8 obtained from number counts alone, CMB alone, tSZ probes alone, and from the combination of the three. In performing the analysis with massive neutrinos, we exclude the values ∑ mν < 0.06 eV, ruled out by neutrino oscillations experiments; see e.g. Patrignani & Particule Data Group (2016). Constraints from CMB primary anisotropies alone worsen, as compared tothe ΛCDM case, because of the low sensitivity of CMB to the neutrino mass. As expected, lower values of σ8 are reached, but along a Ωm − σ8 degeneracy line, parallel to the tSZ degeneracy.
Constraints from tSZ probes alone are not significantly affected by the neutrino mass. As a matter of fact, the high S/N threshold of the Planck cluster sample selects massive clusters (M ≳ 2 × 10¹⁴) whose abundance is not impacted by matter power spectrum damping. The Planck tSZ power spectrum does not probe sufficiently well the small angular scales where the effect of the matter power spectrum damping due to massive neutrinos should take place. However, the addition of estimation of the tSZ power spectrum at ℓ = 3000 from SPT isexpected to increase the sensitivity of the power spectrum to massive neutrinos. The full tSZ probe combinationthus improves the final constraints on cosmological parameters with respect to number counts alone, as can be seen in Fig. 5 and in Table 4. In particular, it provides an upper 95% limit on neutrino mass ∑ mν < 1.88 eV, while number counts alone are only able to provide ∑ mν < 2.84 eV.
Despite the wider CMB constraints along the degeneracy line, we obtain an agreement within 1.3σ between CMB and the tSZ probes. For the constraints obtained from the combination between tSZ probes (+BAO) and CMB, we stress that they are mainly driven by the latter, as can be seen in Fig. 5. We show also the one-dimensional probability distribution for the mass bias for this datasets combination as the light blue line in Fig. 3. The preferred bias value is (1 −b) = 0.67 ± 0.04, of the same order of the ΛCDM case. We highlight that when analysing these results we need to take into account the combined effect of different degeneracies between (1 −b), ∑ mν and σ8. In fact, the preferred high value of σ8 from CMB primary anisotropies data still drives the constraints to lower values of the mass bias, despite the effect of massive neutrinos and the addition of tSZ probes, as shown in Fig. 5 right panel. Finally, we find an upper limit on the neutrino mass of ∑ mν < 0.23 eV at 95% that is more stringent than constraints obtained from CMB alone (∑ mν < 0.49 eV, from Planck Collaboration XIII 2016).
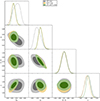 |
Fig. 4 Correlation between cosmological and scaling-relation parameters in the case of tSZ power spectrum (grey), number counts (orange), and for the combination of both (green). |
68% c.l. constraints for cosmological and scaling-relation parameters in the ΛCDM scenario from power spectrum  and number counts (NCtSZ) alone and for the combination of the two probes
  .
.
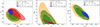 |
Fig. 5 Two-dimensional probability distributions for (Ωm, σ8), (σ8, ∑ mν), and (σ8, (1 − b)) for varying neutrino mass scenario. We report results for number counts (orange), the combination of number counts and power spectrum (green), we add also CMB data (blue), and we show results for CMB alone (red). |
4.2.2 Dark energy EoS
We now consider the extension of the parameter space to dark energy EoS by allowing this parameter to differ from the standard value w = −1 for a cosmological constant. We focus on the simplest case, where w is constant with time, to compare our results with those from Planck Collaboration XXIV (2016). We show the constraints on matter density Ωm and σ8 in Fig. 6 and Table 5. Again, CMB constraints are enlarged along a degeneracy line, but towards higher values of σ8 and lower values of Ωm. Given this shift, we find an increased discrepancy between CMB and tSZ probes, at about 3.6σ, still driven by the σ8 parameter, as shown in Fig. 7. For the combination of tSZ probes we find a value of EoS parameter  (68% c.l.), which is consistent with that found in Planck Collaboration XXIV (2016) (w = −1.01 ± 0.18 for number counts in combination with BAO). We underline that in this case the addition of tSZ power spectrum does not improve the results with respect to number counts alone, as shown in Figs. 6 and 7, while all results are reported in Table 5. For the complete combination of CMB and tSZ, we find the 68% constraints
  . We stress that these results (both for tSZ probes alone and in combination with CMB data) present a 1σ consistency with the standard value w = −1, while results from CMB and BAO reported in Planck Collaboration XXIV (2016) show only a 2σ consistency.
Finally, we stress that in this case as well the preferred value of the mass bias for the complete combination of CMB and tSZ probes is shifted to lower values, (1 − b) = 0.63 ± 0.05, as shown also in Fig. 3, red line.
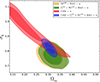 |
Fig. 6 Two-dimensional probability distributions for Ωm and σ8 for varying dark energy EoS scenario, number counts (orange), the combination of number counts and power spectrum (green), the addition of CMB data (blue), and for only CMB (red). |
68% c.l. constraints for cosmological and scaling-relation parameters and 95% upper limits for neutrino mass for varying neutrino mass scenario, from number counts (NC tSZ), the combination of power spectrum and number counts  , the addition of CMB data
  and for CMBalone.
68% c.l. constraints for cosmological and scaling-relation parameters for varying dark energy EoS scenario, from number counts (NC tSZ), the combination of power spectrum and number counts  , the addition of CMB data
  and for CMBalone.
5 Discussion
The tSZ cluster counts and CMB tension reported in Planck Collaboration XXIV (2016), in agreement with constraints obtained independently from the tSZ power spectrum, one-dimensional pdf, and bispectrum (Planck Collaboration XXII 2016), have triggered a lot of interest in the community. On the one hand, multiple estimates of the cluster masses were performed to investigate whether this discrepancy could be attributed to the mass bias (see Fig. 10 for a summary of some of the most recent estimates). On the other hand, multiple cosmological analyses were performed to investigate the CMB/LSS tension or to try to reduce it.
In this study, we provide constraints on cosmological parameters, considering as a baseline theupdated value of the optical depth from Planck Collaboration Int. XLVI (2016), τ = 0.055 ± 0.009 and including the SPT high multipole tSZ spectrum estimate (George et al. 2015). The new value of τ modifies the results from CMB primary anisotropies, increasing the constraining power on σ8 of about 1σ. This is due to the dependence of the CMB power spectrum small-scale regime to the combination σ8 e−τ. Results on σ8 from number counts remain unchanged given that we use the approach and cluster sample from Planck Collaboration XIII (2016). For the tSZ effect, we assume the same baseline model as that of Planck Collaboration XXIV (2016), i.e. we use a mass function from Tinker et al. (2008) and a Gaussian prior on mass bias from Hoekstra et al. (2015), which is in agreement with the average mass bias obtained from the recent weak lensing (WL) estimates (Fig. 10). In this way, we can more easily and directly compare with the results from Planck Collaboration XXIV (2016).
The changes in the CMB results when considering the new value of τ reduce the discrepancy with tSZ counts, i.e. from 2.4 σ to 1.5 σ in the present study. We perform an actual combined analysis of tSZ number counts and power spectrum to carry out a complete MCMC exploration of the parameter space, sampling at the same time on cosmological and scaling-relation parameters. We neglect the correlation between the two combined probes in the likelihood as it is expected to be low with the current Planck cluster sample and large-scale power spectrum estimate (Hurier & Lacasa 2017). We find that the addition of tSZ power spectrum (including Planck and SPT) leads to ~1.8σ tension on σ8 when compared to CMB results. Recent studies, using the LSS probes, also seem to show a disagreement with the best cosmology of the CMB. This includes studies based on cluster samples (Vikhlinin et al. 2009; Hasselfield et al. 2013; Benson et al. 2013; Böhringer & Chon 2016; Böhringer et al. 2017; Schellenberger & Reiprich 2017), on the linear growth rate data (Moresco & Marulli 2017, and references therein), or on cosmic shear (Hildebrandt et al. 2017; van Uitert et al. 2018; Joudaki et al. 2017). Despite intrinsic limitations to each of these probes (e.g. Efstathiou & Lemos 2018), the LSS cosmological analyses exhibit a general trend towards lower values of σ8.
It was noticed in Planck Collaboration XXIV (2016) that there was a factor ~2.5 more clusters predicted than observed when taking into account the CMB cosmology and a mass bias of 0.8. The new optical depth reduces the σ8 derived from the CMB analysis to σ8 = 0.817 ± 0.018. Nevertheless, assuming a mass bias of 0.8 (average value of recent WL estimates), due to the high value of σ8, we still find a difference between predicted and observed low redshift (z < 0.3) cluster number counts of the order of 2.5 (Fig. 8). We obtain a consistent discrepancy also for the tSZ power spectrum. Assuming again a mass bias of 0.8, the predicted power spectrum from CMB data shows an amplitude a factor of two higher than the measured tSZ power spectrum, as shown in Fig. 9.
More biased estimates of the cluster mass could explain this difference, and in turn reduce the tSZ/CMB tension since cosmological parameters are degenerate with scaling-relation parameters. We thus focus on the mass bias (1 − b). We show results for the combination of CMB primary anisotropies and number counts and the complete combination of CMB andtSZ probes, all using the updated value of the optical depth. For the first case, we find a low value for the mass bias (1 −b) = 0.62 ± 0.07 that is fully consistent with results from Planck Collaboration XXIV (2016), while for the latter case, the addition of tSZ power spectrum data increases the bias of about 2σ with respect to Planck Collaboration XXIV (2016). This leads to (1 −b) = 0.63 ± 0.04. Hydrostatic mass estimates from X-ray observations (used to derive the scaling relation of Eq. (13)) are known to be biased low from numerical simulation, but by not more than 20% (Lau et al. (2013); Biffi et al. (2016), and a compilation of comparisons in Planck Collaboration XX (2014), purple area in Fig. 10). With higher number of high-resolution optical observations of cluster samples and improved weak lensing mass measurements, many comparisons were made between X-ray or tSZ masses and WL masses. Assuming that WL reconstruction provides unbiased estimates of the true mass, many teams derived bias estimates (e.g. Medezinski et al. 2018; Sereno et al. 2017; Jimeno et al. 2018; Parroni et al. 2017; Okabe & Smith 2016; Battaglia et al. 2016; Applegate et al. 2016; Smith et al. 2016; Hoekstra et al. 2015; Simet et al. 2015; Israel et al. 2015; von der Linden et al. 2014; Donahue et al. 2014; Gruen et al. 2014; Mahdavi et al. 2013, shown as black dots, from top to bottom, in Fig. 10). These biases average around a value of (1 −b) ~ 0.8 ± 0.08; one low mass bias was estimated in von der Linden et al. (2014).
As seen in Fig. 10, where we plot the highest mass bias possibly obtained from our combined analysis, we find values of (1 − b) that do not agree with those derived from numerical simulations and observations. Moreover, reducing the SZ-CMB tension by allowing lower values of (1 − b) does not seem to be sufficient for alleviating the global difference between low-z- and high-z-based cosmological parameters.
Anotherway to reconcile CMB and tSZ is to relax some assumptions of the standard model. In particular, we find (1 −b) = 0.67 ± 0.04 when adding massive neutrinos and (1 − b) = 0.63 ± 0.04 when opening the parameter space to a varying EoS parameter. This implies that even by exploring extension to ΛCDM, the complete combination of CMB and tSZ probes still points towards low values of (1 −b) and does not allow us to fully reconcile the probes.
As of today, the cluster number counts do not suffer from statistical uncertainty, but the counts are rather limited by systematic effects, mainly the mass estimates. The tSZ power spectrum, in turn, is not measured with sufficient accuracy, especially at small angular scales, to reduce the tension with CMB. The tSZ cosmological analysis can be improved by considering more realistic and complex hypotheses on the mass bias (e.g. redshift and/or mass dependence), the pressure profile, and mass function. Regarding the latter, we recall here that the choice of mass function affects the final results on cosmological parameters, as shown, for example in Planck Collaboration XXIV (2016). For the current accuracy and precision obtained by tSZ probes measurements, different choices produce only a ~1σ shift of constraints along the same degeneracy line in the (Ωm, σ8) plane of parameters, therefore not affecting the discrepancy between tSZ probes and CMB data. Nevertheless, with future and more accurate measurements, it would also be necessary to marginalize over all the nuisance parameters (e.g. mass function fitting formula and bias dependencies).
The analysis can also be improved by refining the likelihood analysis, such as including correlations between probes, missing or inaccurate redshifts (e.g. Bonaldi et al. 2014), and additional tSZ probes (e.g. bispectrum; Hurier & Lacasa 2017).
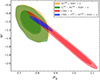 |
Fig. 7 Two-dimensional probability distributions for σ8 and w for varying dark energy EoS scenario, for number counts (orange), the combination of number counts and power spectrum (green), the addition of CMB data (blue), and for only CMB (red). |
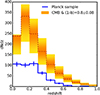 |
Fig. 8 tSZ cluster sample from Planck (blue line) compared with predicted counts with CMB best-fit cosmological parameters and (1 − b) = 0.8 ± 0.08 (red line and orange envelope). |
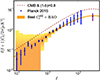 |
Fig. 9 tSZ power spectrum from Planck (blue points) and SPT (purple point) compared with predicted counts with CMB best-fit cosmological parameters and (1 − b) = 0.8 (red line) and our best fit (orange envelope). |
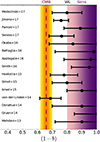 |
Fig. 10 Comparison of estimates of the mass bias from combined LCDM SZ and CMB analysis, WL-hydrostatic mass ratio, and simulations. See text for references to the mass bias estimates from the WL analyses. |
6 Conclusion
We have updated the constraints on cosmological parameters from tSZ cluster counts and power spectrum, using the most recent optical depth value from Planck and performing a combined analysis of the two probes; we have also added CMB data. In the ΛCDM case, we find that the combined analysis of tSZ counts and power spectrum improves the accuracy on Ωm and σ8 constraints slightly and leads to a discrepancy of almost 1.8σ on σ8 when compared to CMB results.
We then consider the effect of massive neutrinos, finding that the combination of tSZ counts and power spectrum allows us to obtain an upper limit on the neutrino mass, ∑ mν < 1.88 eV, resulting in an improvement of almost 30% compared to number counts alone. Despite being weak compared to other cosmological probes, tSZ data alone provide us with an independent constraint that can be combined in particular with CMB. In this case, the combination of tSZ probes and CMB leads a 95% upper limit on massive neutrinos of ∑ mν < 0.23 eV. Moreover, because of the enlargement of CMB constraints, we find that CMB results and combined tSZ results on σ8 agree within 1.3 σ. When we allow the EoS parameter w for the dark energy to vary, the tSZ and CMB still show a higher 3.6σ discrepancy on σ8. The full combination of probes provides w = −1.03 ± 0.07 that is consistent with the standard w = −1 value.
Finally, we find that the complete combination of tSZ probes and CMB data points towards low values of the mass bias (almost 2σ discrepancy) with respect to simulations and to other tracers of LSS. Such a difference between mass estimates implies that, regardless of the CMB/LSS tension, a better understanding of the intrinsic systematic effects and differences between probes is needed.
Acknowledgements
The authors acknowledge helpful discussions with Boris Bolliet. L.S. acknowledges support from the grant “Borsa di studio di perfezionamento all’estero” from University of Rome, Sapienza and “Fondazione Angelo della Riccia”. Based on observations obtained with Planck (http://www.esa.int/Planck), an ESA science mission with instruments and contributions directly funded by ESA Member States, NASA, and Canada. This project has received funding from the European Research Council (ERC) under the European Union’s Horizon 2020 research and innovation programme grant agreement ERC-2015-AdG 695561.
References
- Allen, S. W., Evrard, A. E., & Mantz, A. B. 2011, ARA&A, 49, 409 [NASA ADS] [CrossRef] [Google Scholar]
- Anderson, L., Aubourg, É., Bailey, S. et al. 2014, MNRAS, 441, 24 [NASA ADS] [CrossRef] [Google Scholar]
- Applegate, D. E., Mantz, A., Allen, S. W., et al. 2016, MNRAS, 457, 1522 [NASA ADS] [CrossRef] [Google Scholar]
- Arnaud, M., Pratt, G. W., Piffaretti, R., et al. 2010, A&A, 517, A92 [NASA ADS] [CrossRef] [EDP Sciences] [Google Scholar]
- Battaglia, N., Leauthaud, A., Miyatake, H., et al. 2016, J. Cosmology Astropart. Phys., 8, 013 [Google Scholar]
- Benson, B. A., de Haan, T., Dudley, J. P., et al. 2013, ApJ, 763, 147 [NASA ADS] [CrossRef] [Google Scholar]
- Biffi, V., Borgani, S., Murante, G., et al. 2016, ApJ, 827, 112 [NASA ADS] [CrossRef] [Google Scholar]
- Bleem, L. E., Stalder, B., De Haan, T., et al. (SPT Collaboration) 2015, ApJS, 216, 27 [NASA ADS] [CrossRef] [Google Scholar]
- Boehringer, H., Chon, G., Retzlaff, J., et al. 2017, AJ, 153, 220 [NASA ADS] [CrossRef] [Google Scholar]
- Böhringer, H., & Chon, G. 2016, Mod. Phys. Lett. A, 31, 1640008 [NASA ADS] [CrossRef] [Google Scholar]
- Böhringer, H., Chon, G., Retzlaff, J., et al. 2017, AJ, 153, 220 [NASA ADS] [CrossRef] [Google Scholar]
- Bonaldi, A., Battye, R., & Brown, M. L. 2014, ApJ, 786, 88 [NASA ADS] [CrossRef] [Google Scholar]
- Chon, G., & Boehringer, H. 2012, A&A, 538, A35 [NASA ADS] [CrossRef] [EDP Sciences] [Google Scholar]
- Cooray, A. 2000, Phys. Rev., D62, 103506 [Google Scholar]
- Cooray, A. 2001, Phys. Rev., D64, 063514 [NASA ADS] [Google Scholar]
- Donahue, M., Voit, G. M., Mahdavi, A., et al. 2014, ApJ, 794, 136 [NASA ADS] [CrossRef] [Google Scholar]
- Efstathiou, G., & Lemos, P. 2018, MNRAS, 476, 151 [NASA ADS] [CrossRef] [Google Scholar]
- George, E. M., Reichardt, C. L., Aird, K. A., et al. 2015, ApJ, 799, 177 [NASA ADS] [CrossRef] [Google Scholar]
- Gruen, D., Seitz, S., Brimioulle, F., et al. 2014, MNRAS, 442, 1507 [NASA ADS] [CrossRef] [Google Scholar]
- Hasselfield, M., Hilton, M., Marriage, T. A., et al. 2013, J. Cosmology Astropart. Phys., 7, 008 [Google Scholar]
- Hildebrandt, H., Viola, M., Heymans, C., et al. 2017, MNRAS, 465, 1454 [Google Scholar]
- Hoekstra, H., Herbonnet, R., Muzzin, A., et al. 2015, MNRAS, 449, 685 [NASA ADS] [CrossRef] [Google Scholar]
- Horowitz, B., & Seljak, U. 2017, MNRAS, 469, 394 [NASA ADS] [CrossRef] [EDP Sciences] [Google Scholar]
- Hurier, G., & Lacasa, F. 2017, A&A, 604, A71 [NASA ADS] [CrossRef] [EDP Sciences] [Google Scholar]
- Israel, H., Schellenberger, G., Nevalainen, J., Massey, R., & Reiprich, T. H. 2015, MNRAS, 448, 814 [NASA ADS] [CrossRef] [Google Scholar]
- Jimeno, P., Diego, J.-M., Broadhurst, T., De Martino, I., & Lazkoz, R. 2018, MNRAS, in press [arXiv:1706.00395] [Google Scholar]
- Joudaki, S., Blake, C., Johnson, A., et al. 2017, MNRAS, 474, 4894 [Google Scholar]
- Komatsu, E., & Kitayama, T. 1999, ApJ, 526, L1 [NASA ADS] [CrossRef] [PubMed] [Google Scholar]
- Komatsu, E., & Seljak, U. 2002, MNRAS, 336, 1256 [NASA ADS] [CrossRef] [Google Scholar]
- Lau, E. T., Nagai, D., & Nelson, K. 2013, ApJ, 777, 151 [NASA ADS] [CrossRef] [Google Scholar]
- Lesgourgues, J., & Pastor, S. 2012, Adv. High Energy Phys., 2012, 608515 [CrossRef] [Google Scholar]
- Lewis, A., & Bridle, S. 2002, Phys. Rev., D66, 103511 [Google Scholar]
- Mahdavi, A., Hoekstra, H., Babul, A., et al. 2013, ApJ, 767, 116 [NASA ADS] [CrossRef] [Google Scholar]
- Marriage, T. A., Acquaviva, V., Ade, P. A., et al. 2011, ApJ, 737, 61 [NASA ADS] [CrossRef] [Google Scholar]
- Medezinski, E., Battaglia, N., Umetsu, K., et al. 2018, PASJ, 70, S28 [Google Scholar]
- Moresco, M., & Marulli, F. 2017, MNRAS, 471, L82 [NASA ADS] [CrossRef] [Google Scholar]
- Okabe, N., & Smith, G. P. 2016, MNRAS, 461, 3794 [NASA ADS] [CrossRef] [Google Scholar]
- Parroni, C., Mei, S., Erben, T., et al. 2017, ApJ, 848, 114 [NASA ADS] [CrossRef] [Google Scholar]
- Patrignani, C., & Particule Data Group, 2016, Chin. Phys., C40, 100001 [Google Scholar]
- Planck Collaboration XVI. 2014, A&A, 571, A16 [NASA ADS] [CrossRef] [EDP Sciences] [Google Scholar]
- Planck Collaboration XX. 2014, A&A, 571, A20 [NASA ADS] [CrossRef] [EDP Sciences] [Google Scholar]
- Planck Collaboration XXI. 2014, A&A, 571, A21 [NASA ADS] [CrossRef] [EDP Sciences] [Google Scholar]
- Planck Collaboration XXIX. 2014, A&A, 571, A29 [NASA ADS] [CrossRef] [EDP Sciences] [Google Scholar]
- Planck Collaboration I. 2016, A&A, 594, A1 [NASA ADS] [CrossRef] [EDP Sciences] [Google Scholar]
- Planck Collaboration XI. 2016, A&A, 594, A11 [NASA ADS] [CrossRef] [EDP Sciences] [Google Scholar]
- Planck Collaboration XIII. 2016, A&A, 594, A13 [NASA ADS] [CrossRef] [EDP Sciences] [Google Scholar]
- Planck Collaboration XXII. 2016, A&A, 594, A22 [NASA ADS] [CrossRef] [EDP Sciences] [Google Scholar]
- Planck Collaboration XXIV. 2016, A&A, 594, A24 [NASA ADS] [CrossRef] [EDP Sciences] [Google Scholar]
- Planck Collaboration XXVI. 2016, A&A, 594, A26 [NASA ADS] [CrossRef] [EDP Sciences] [Google Scholar]
- Planck Collaboration Int. XLVI 2016, A&A, 596, A107 [NASA ADS] [CrossRef] [EDP Sciences] [Google Scholar]
- Planck Collaboration Int. XLVII 2016, A&A, 596, A108 [NASA ADS] [CrossRef] [EDP Sciences] [Google Scholar]
- Rykoff, E. S., Rozo, E., Hollowood, D., et al. 2016, ApJS, 224, 1 [NASA ADS] [CrossRef] [Google Scholar]
- Schellenberger, G. & Reiprich, T. H. 2017, MNRAS, 471, 1370 [NASA ADS] [CrossRef] [Google Scholar]
- Sereno, M., Covone, G., Izzo, L., et al. 2017, MNRAS, 472, 1946 [NASA ADS] [CrossRef] [Google Scholar]
- Simet, M., Battaglia, N., Mandelbaum, R., & Seljak, U. 2015, in American Astronomical Society Meeting Abstracts, 225, 443.04 [Google Scholar]
- Smith, G. P., Mazzotta, P., Okabe, N., et al. 2016, MNRAS, 456, L74 [NASA ADS] [CrossRef] [Google Scholar]
- Sunyaev, R. A., & Zeldovich, Ya. B. 1970, Ap&SS, 7, 20 [Google Scholar]
- Tinker, J., Kravtsov, A. V., Klypin, A., et al. 2008, ApJ, 688, 709 [NASA ADS] [CrossRef] [Google Scholar]
- van Uitert, E., Joachimi, B., Joudaki, S., et al. 2018, MNRAS, 476, 4462 [Google Scholar]
- Vikhlinin, A., Kravtsov, A. V., Burenin, R. A., et al. 2009, ApJ, 692, 1060 [NASA ADS] [CrossRef] [Google Scholar]
- von der Linden, A., Mantz, A., Allen, S. W., et al. 2014, MNRAS, 443, 1973 [NASA ADS] [CrossRef] [Google Scholar]
- Watson, W. A., Iliev, I. T., D’Aloisio, A., et al. 2013, MNRAS, 433, 1230 [Google Scholar]
All Tables
Priors on nuisance parameters for scaling relations, as defined in Planck Collaboration XXIV (2016).
Figures of merit (FoM) for tSZ spectrum alone, number counts alone, the combination of the two probes, and for Ωm and σ8 parameters in the ΛCDM scenario.
68% c.l. constraints for cosmological and scaling-relation parameters in the ΛCDM scenario from power spectrum and number counts (NCtSZ) alone and for the combination of the two probes .
68% c.l. constraints for cosmological and scaling-relation parameters and 95% upper limits for neutrino mass for varying neutrino mass scenario, from number counts (NC tSZ), the combination of power spectrum and number counts , the addition of CMB data and for CMBalone.
68% c.l. constraints for cosmological and scaling-relation parameters for varying dark energy EoS scenario, from number counts (NC tSZ), the combination of power spectrum and number counts , the addition of CMB data and for CMBalone.
All Figures
|
Fig. 1 Two-dimensional probability distributions for τ and σ8 for various values of optical depths (see text). We compare results for SZ number counts alone (pink and purple) and for CMB data alone (blue and light blue). |
| In the text | |
|
Fig. 2 Two-dimensional probability distributions for Ωm and σ8 in the ΛCDM scenario, only power spectrum (grey), only number counts (orange), the combination of the two probes (green), only CMB (red), and the combination of all the probes (blue). |
| In the text | |
|
Fig. 3 One-dimensional probability distribution for the mass bias (1 − b) for various dataset combinations: the complete tSZ combination and BAO (orange); CMB and the complete tSZ combination (blue, almost completely overlapped by the red line); CMB and number counts (green); the combination of CMB and tSZ, adding the effect of massive neutrinos (light blue); and the combination of CMB and tSZ, adding the effect of varying the dark energy EoS parameter (red). All of these combinations are compared to the CCCP prior we used in our analysis (black). |
| In the text | |
|
Fig. 4 Correlation between cosmological and scaling-relation parameters in the case of tSZ power spectrum (grey), number counts (orange), and for the combination of both (green). |
| In the text | |
|
Fig. 5 Two-dimensional probability distributions for (Ωm, σ8), (σ8, ∑ mν), and (σ8, (1 − b)) for varying neutrino mass scenario. We report results for number counts (orange), the combination of number counts and power spectrum (green), we add also CMB data (blue), and we show results for CMB alone (red). |
| In the text | |
|
Fig. 6 Two-dimensional probability distributions for Ωm and σ8 for varying dark energy EoS scenario, number counts (orange), the combination of number counts and power spectrum (green), the addition of CMB data (blue), and for only CMB (red). |
| In the text | |
|
Fig. 7 Two-dimensional probability distributions for σ8 and w for varying dark energy EoS scenario, for number counts (orange), the combination of number counts and power spectrum (green), the addition of CMB data (blue), and for only CMB (red). |
| In the text | |
|
Fig. 8 tSZ cluster sample from Planck (blue line) compared with predicted counts with CMB best-fit cosmological parameters and (1 − b) = 0.8 ± 0.08 (red line and orange envelope). |
| In the text | |
|
Fig. 9 tSZ power spectrum from Planck (blue points) and SPT (purple point) compared with predicted counts with CMB best-fit cosmological parameters and (1 − b) = 0.8 (red line) and our best fit (orange envelope). |
| In the text | |
|
Fig. 10 Comparison of estimates of the mass bias from combined LCDM SZ and CMB analysis, WL-hydrostatic mass ratio, and simulations. See text for references to the mass bias estimates from the WL analyses. |
| In the text | |
Current usage metrics show cumulative count of Article Views (full-text article views including HTML views, PDF and ePub downloads, according to the available data) and Abstracts Views on Vision4Press platform.
Data correspond to usage on the plateform after 2015. The current usage metrics is available 48-96 hours after online publication and is updated daily on week days.
Initial download of the metrics may take a while.