| Issue |
A&A
Volume 614, June 2018
|
|
|---|---|---|
| Article Number | A34 | |
| Number of page(s) | 11 | |
| Section | Astrophysical processes | |
| DOI | https://doi.org/10.1051/0004-6361/201731922 | |
| Published online | 11 June 2018 | |
In-depth study of long-term variability in the X-ray emission of the Be/X-ray binary system AX J0049.4−7323
1
Institut für Astronomie und Astrophysik, Kepler Center für Astro und Teilchen-Physik, Eberhard Karls Universität,
Sand 1,
72076
Tübingen, Germany
e-mail: This email address is being protected from spambots. You need JavaScript enabled to view it.
2
Data Centre for Astrophysics, Astronomy Department of the University of Geneva, Université de Genève,
16 chemin d’Écogia,
1290
Versoix, Switzerland
3
INAF – Osservatorio Astronomico di Brera,
Via Bianchi 46,
23807
Merate, Italy
4
NASA Marshall Space Flight Center, NSSTC,
320 Sparkman Drive,
Huntsville,
AL
35805, USA
5
Universities Space Research Association, NSSTC,
320 Sparkman Drive,
Huntsville,
AL
35805, USA
Received:
9
September
2017
Accepted:
3
February
2018
Abstract
AX J0049.4−7323 is a Be/X-ray binary in the Small Magellanic Cloud hosting a ~750 s pulsar which has been observed over the last ~17 years by several X-ray telescopes. Despite numerous observations, little is known about its X-ray behaviour. Therefore, we coherently analysed archival Swift, Chandra, XMM-Newton, RXTE, and INTEGRAL data, and we compared them with already published ASCA data, to study its X-ray long-term spectral and flux variability. AX J0049.4−7323 shows a high X-ray variability, spanning more than three orders of magnitudes, from L ≈ 1.6 × 1037 erg s−1 (0.3−8 keV, d = 62 kpc) down to L ≈ 8 × 1033 erg s−1. RXTE, Chandra, Swift, and ASCA observed, in addition to the expected enhancement of X-ray luminosity at periastron, flux variations by a factor of ~270 with peak luminosities of ≈2.1 × 1036 erg s−1 far from periastron. These properties are difficult to reconcile with the typical long-term variability of Be/XRBs, traditionally interpreted in terms of type I and type II outbursts. The study of AX J0049.4−7323 is complemented with a spectral analysis of Swift, Chandra, and XMM-Newton data which showed a softening trend when the emission becomes fainter, and an analysis of optical/UV data collected by the UVOT telescope on board Swift. In addition, we measured a secular spin-up rate of Ṗ = (−3.00 ± 0.12) × 10−3 s day−1, which suggests that the pulsar has not yet achieved its equilibrium period. Assuming spherical accretion, we estimated an upper limit for the magnetic field strength of the pulsar of ≈3 × 10¹² G.
Key words: accretion, accretion disks / stars: neutron / X-rays: individuals: AX J0049.4−7323 / X-rays: binaries
NASA Postdoctoral Fellow.
© ESO 2018
1 Introduction
AX J0049.4−7323 was discovered by Ueno et al. (2000) in ASCA observations of the Small Magellanic Cloud (SMC). It hosts a neutron star (NS) with a pulse period of ≈750 s (Yokogawa et al. 2000) and a Be star (Edge & Coe 2003) of spectral type O9.5-B0.5 III–V (McBride et al. 2008). A spectroscopic analysis of the optical counterpart of AX J0049.4−7323 showed a double-peaked Hα emission profile, suggesting that the circumstellar disc was observed through the plane of rotation (Edge & Coe 2003). Laycock et al. (2005) and Cowley & Schmidtke (2003) detected a periodicity of ≈395 days in X-ray and optical bands interpreted as the orbital period of the NS. Schmidtke et al. (2013) combined MACHO and OGLE data to refine the optical period and ephemeris to Porb = 393.1 ± 0.4 days and T0 = 52979.5 ± 4 MJD. Coe & Edge (2004) noticed that the two RXTE outbursts (exceeding 3 × 1037 erg s−1 in 3−10 keV, assuming a distance of d = 62 kpc) used by Laycock et al. (2005) to estimate the orbital period were synchronized with the optical outbursts. Galache et al. (2008) reported further RXTE/PCA detections of AX J0049.4−7323 in outburst, the brightest of which lasted three weeks. AX J0049.4−7323 was also detected by INTEGRAL during an outburst that reached an X-ray luminosity ≳ 1037 erg s−1 (Coe et al. 2010). AX J0049.4−7323 was also detected three times by ASCA. In all these cases, it was observed far from the optical outbursts and it showed an X-ray luminosity of 5 × 1035 erg s−1 (Coe & Edge 2004). An analysis of archival ROSAT and Einstein data showed AX J0049.4−7323 at a relatively low luminosity level (≤ 5 × 1035 erg s−1) for over 20 years (Yokogawa et al. 2000). As noted by Coe & Edge (2004), the three ASCA detections at high X-ray luminosities were difficult to explain in the context of the typical variability displayed by Be/X-ray binaries (Be/XRBs). In general, Be/XRBs are transient X-ray sources with high eccentric orbits (e ≳ 0.3; Reig 2011). The bright X-ray events characterizing the X-ray variability of Be/XRBs are schematically divided into two groups, called type I and type II outbursts. Type I outbursts are periodic (or quasi-periodic) events, occurring in correspondence with the periastron. They last for a small fraction of the orbit (0.2−0.3 Porb) and their maximum luminosity is typically of the order of ≲ 1037 erg s−1. They exceeds at least two orders of magnitude with respect to the quiescent state, when the luminosity is ≲ 1035 erg s−1. Type II outbursts are not periodic and can peak at any orbital phase. They are brighter than type I outbursts and can reach X-ray luminosities of ≈ 1038 erg s−1. They last for a large fraction of the orbit or for several orbital periods (Reig 2011). Tidal and resonant interactions of the NS with the circumstellar disc can lead to the truncation of the latter at a radial distance which depends on the viscosity of the disc (Okazaki & Negueruela 2001; Negueruela & Okazaki 2001). In binary systems with low eccentricity (e ≲ 0.2), the gap size betweenthe outer radius of the truncated disc and the orbit is so large that no type I outbursts occur. These systems show only type II outbursts and only occasionally type I outbursts, when the disc is strongly disturbed (Reig 2011). In binary systems with high eccentricity (e ≳ 0.6) the disc truncation is not efficient. At every periastron passage, the mass accretion rate is large enough to cause regular type I outbursts (Okazaki & Negueruela 2001). For systems with moderate eccentricity, the situation is more complicated. The global properties of their X-ray variability depend more closely on the orbital separation and viscosity properties of the circumstellar disc (Okazaki & Negueruela 2001). The ASCA detections at luminosities of 5 × 1035 erg s−1 could not be classified as type I because they were not observed at periastron and they were not bright enough for type II (Coe & Edge 2004). The observations in hand of Coe & Edge (2004) were insufficient to draw further conclusions about the anomalous X-ray behaviour shown by AX J0049.4−7323. Therefore, the aim of this work is to provide a detailed analysis of the largest possible set of X-ray data to infer more information about the main properties of this system through a global study of the X-ray long-term flux and spectral variability. We coherently analysed Swift (XRT and UVOT), Chandra, XMM-Newton, RXTE, and INTEGRAL data (collected over the last ~17 years and corresponding to a total exposure time of ~5.86 ms; Sect. 2). The results are presented in Sect. 3 and discussed in Sect. 4.
2 Reduction and data analysis
2.1 Swift
The SMC has been observed repeatedly with Swift (Gehrels et al. 2004) since its launch; in particular, starting on 2016 June 8, the SMC has been observed as part of the Swift survey of the Small Magellanic Cloud (Kennea et al. 2016). Therefore, we collected all observations in which the source was within the field of view of the narrow-field instruments, the X-ray Telescope (XRT, Burrows et al. 2005) and the UV/Optical Telescope (UVOT, Roming et al. 2005). The observations are listed in Table 1.
The XRT data were uniformly processed and analysed using the standard software (FTOOLS1 v6.20), calibration (CALDB2 20170501), and methods. We used the task XRTPIPELINE (v0.13.3) to process and filter the XRT data, and extracted source events from a circular region with a radius of 10 pixels (1 pixel corresponds to 2.36′′). Background events were extracted in most cases from an annular region with an inner radius of 30 pixels and an external radius of 70 pixels centred at the source position, the exception being when the source was close to the edge of the FOV; in this case we used a circular region (with a radius of 50–70 pixels). The data are not affected by pile-up. The XRT light curve was corrected for point spread function (PSF) losses and vignetting and background subtracted. For the spectral analysis, we extracted events in the regions described above. Then, we used xrtmkarf to generate ancillary response files that account for different extraction regions, vignetting, and PSF corrections. Spectra were extracted in each individual observation and in several datasets combined. All were binned at 1 count per bin and fit adopting Cash (Cash 1979) statistics.
When no detection was achieved, the corresponding 3σ upper limit on the X-ray count rate was estimated by using the tasks sosta and uplimit within XIMAGE (with the background calculated in the neighbourhood of the source position) and the Bayesian method for low-count experiments adapted from Kraft et al. (1991).
UVOT observed the target simultaneously with XRT. As the observations were obtained from the Swift archive, there is no uniformity of filter usage in the UVOT data. The data analysis was performed using the uvotimsum and uvotsource tasks included in FTOOLS. The uvotsource task calculates the magnitude of the source through aperture photometry within a circular region centred on the best source position and applies the required corrections related to the specific detector characteristics. We adopted a circular region with a radius of 5′′ for the photometry of the different sources. The background was evaluated in all cases by using circular regions with a radius of 10′′. For the magnitude uncertainties, we added in quadrature the systematic errors provided by UVOTSOURCE.
2.2 Chandra
Chandra data have been explored to analyse the long-term behaviour of AX J0049.4−7323. We extracted images for each of the Chandra observations in which the source was detected within the ACIS field of view(see Table 3). We applied the latest Chandra calibration files to each image and we reduced the data with the Chandra Interactive Analysis of Observations software package (CIAO, version 4.9). Source fluxes were extracted with the CIAO tool srcflux (Glotfelty 2014). We extracted source events from circular regions with radius of about 3″−5″, while the background was extracted from an annular region around the source, with internal radius as large as twice that of the source region and outer radius equal to about 5 times the source radius. The extraction energy band was constrained to 0.3–8 keV. Due to the low count rates detected from this source and its peripheral position on the ACIS detectors (which smears the detection region), pile-up effects are negligible (pile-up fraction generally < 1%). Chandra spectra have been extracted using the CIAO specextract tool and analysed using XSPEC (ver. 12.9.1, Arnaud 1996). Spectral channels were rebinned to contain at least 25 photons per energy bin.
2.3 XMM-Newton
XMM-Newton observed three times the field around AX J0049.4−7323: 2000-10-15 15:09:54 (UTC), 2007-04-11 19:37:46, and 2009-10-03 05:08:04 (see Table 3). The data analysis of each observation was performed through the XMM-Newton Science Analysis System (SAS) sofware (version 15.0.0). Time intervals affected by high background were excluded, and calibrated event lists for pn, MOS1, and MOS2 were produced using the epproc and emproc tasks. For the pn data we used single- and double-pixel events (PATTERN ≤ 4), while for the MOS data, single-pixel to quadruple-pixel events (PATTERN ≤ 12) were used. For each observation we extracted in each detector the source events in circular regions centred on the target, using appropriate radii, according to the brightness of the source and its location in the detector. Background events were accumulated from source-free circular regions far from the PSF of the source. We extracted the spectra of the first two observations. Spectral channels were rebinned to contain at least 25 photons per energy bin. For each observation, we fitted all the available EPIC spectra simultaneously using XSPEC.
Summary of the Swift/XRT observations.
2.4 RXTE
We analysed RXTE/PCA corresponding to the detections reported in Yang et al. (2017) and Klus et al. (2014). We used Standard 2 mode PCA data and, for each observation, we extracted light curves in the 3−10 keV energy range, with time bins of 16 s. Data were screened with standard criteria. Corrections for deadtime were applied. We selected events in all the active PCUs and layers. The barycentric correction was applied using faxbary.
2.5 INTEGRAL
We used data collected by the detector ISGRI of the coded-mask telescope IBIS (Lebrun et al. 2003; Ubertini et al. 2003). ISGRI operates in the energy band ~15–400 keV. INTEGRAL observations consist of pointings called science windows (ScWs). We performed the data reduction using the Off-line Science Analysis(OSA) 10.2 software. We analysed the public data from 2003 July 23 to 2015 December 7 (52 843.96–57 363.26 MJD) in which AX J0049.4−7323 was within 12° of the centre of the IBIS/ISGRI field of view3. The total exposure time is ≈5.86 Ms. INTEGRALobservations from 2008 November 11 to 2009 June 25 were already analysed and the results presented in Coe et al. (2010). These data are re-analysed here to ensure uniformity.
3 Results
3.1 Spectral analysis
For Chandra, XMM-Newton, and Swift observations with sufficiently high statistics, we extracted X-ray spectra. We found that a simple absorbed power law model instead of a more complicated model, such as an absorbed cutoff power law, can describe the spectra adequately well. This is due to the relatively poor statistics and the high value of the e-folding energy of this source which, according to Laycock et al. (2005), is Ef =14 keV, hence outside of the energy range covered by our data. For the absorption component, we adopted tbabs in XSPEC. The values of the spectral parameters are listed in Table 3. The Galactic absorption in the direction of AX J0049.4−7323 ranges from NH ≈ 4 × 1020 cm−2 to NH ≈ 4 × 1021 cm−2 (Kalberla et al. 2005; Dickey & Lockman 1990). Due to this large uncertainty, we decided not to include a fixed foreground absorption component in the spectral model. The column densities resulting from the spectral fit (Table 3) are always slightly higher than the lower value of the foreground absorption reported above, indicating a non-negligible intrinsic absorption around the source. For observations with insufficient statistics to perform a spectral analysis, we reported in Table 3 the flux in the range 0.3−8 keV obtained from the conversion of the count rate, assuming an absorbed power law spectrum with NH = 4 × 1021 cm−2 and photon index of 0.8. The results of the spectral analysis of the two XMM-Newton observations 0110000101 and 0404680301 and the Chandra observations 8479, 7156, and 8481 are consistent, within the 90% confidence level (c.l.) with those reported in Haberl & Pietsch (2004), Haberl et al. (2008), and Hong et al. (2017). The observed X-ray fluxes are also consistent with those reported by Yang et al. (2017). The results from the other observations are published here for the first time. The slopes of the power law given in Table 3 are typical of accreting pulsars.
We grouped the Chandra observations of the source detected at the lowest luminosity state (when Fx < 10−12 erg cm−2 s−1) to perform a meaningful spectral analysis. The resulting average spectrum can be fitted with an absorbed power law model with  cm−2,
cm−2,  ,
,  (11 dof). The power law slope is higher than in the observations where the source is detected at higher fluxes (Table 3).
The upper panel of Fig. 1 shows the values of NH and Γ in Table 3 as a function of the absorbed flux. The plot shows that the spectral slope softens at lower fluxes (Γ = (−4.0 ± 1.7) × log10Fx − (0.4 ± 0.14), errors quoted at 1σ c.l.). To quantify the significance of the anticorrelation Γ vs. flux, we calculated the Pearson’s linear coefficient r and the null hypothesis probability p in the log10x − y space. We found r = −0.83 and p = 0.5%. The parameter NH does not show a significant correlation with flux; in fact, a linear fit of NH vs. log10Fx results in NH ∝ (0.17 ± 0.22) × log10Fx, where the error is quoted at 2σ c.l. The slope is thus consistent with zero at 2σ c.l. To highlight the significant spectral variability of AX J0049.4−7323, we show in Fig. 1, lower panel, the 68%, 95%, and 99% confidence contours in the NH −Γ plane of the average Chandra spectrum at the lowest luminosity level (the ‘combined’ spectrum in Table 3) and the XMM-Newton spectra where the flux was up to ~20 times larger.
3.2 Timing analysis
We used the Lomb–Scargle periodogram technique (Press & Rybicki 1989) to search for periodicities in XMM-Newton, Chandra, and RXTE data. Swift observations were too short compared to the spin period of AX J0049.4−7323 to search for periodicities. For RXTE data, we performed timing analysis in each observation and in groups of observations within one day. We searched for periodicities within a small window ranging from 720 to 780 s. We set the limits of this window on the basis of the spin period history of the source reported by Yang et al. (2017). We set a false alarm probability of detection of 99.9%. The number of independent trial frequencies was calculated according to Eq. (13) of Horne & Baliunas (1986). We detected pulsations in the XMM-Newton observations 0110000101 and 0404680301, and in the Chandra observations 8479, 7156, and 8481. For these observations, our measurements of the spin period are in agreement with those reported in Haberl et al. (2008) and Hong et al. (2017), hence hereafter we use the Chandra and XMM-Newton spin periods published in those papers. In the other Chandra and XMM-Newton observations we did not detect any pulsating signal probably because of the insufficient statistics (see Sect. 4.2.1). We detected AX J0049.4−7323 in the RXTE observations reported in Table 2. Figure 2 shows the long-term spin period evolution of AX J0049.4−7323. In addition to the spin period measurements obtained in this work, we included the spin period measured by Yokogawa et al. (2000) using ASCA (PASCA = 755.5 ± 0.6 s). Figure 2 shows a significant long-term spin-up of Ṗ = (−3.00 ± 0.12) × 10−3 s day−1.
The source does not show significant variability such as flares within each observation, in agreement with previous findings obtained by Hong et al. (2017), Haberl et al. (2008), and Haberl & Pietsch (2004), based on Chandra and XMM-Newton data.
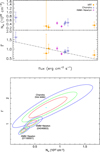 |
Fig. 1 Top panel: column density and photon index as a function of the absorbed flux (errors quoted at 1σ c.l.). Theplotted values correspond to those listed in Table 3. The anti-correlation Γ vs. flux is emphasized by the dot-dashed line, which shows the best linear fit (Γ vs. log 10 Fx). Bottom panel: confidence contours at 68%, 95%, and 99% in the NH −Γ plane of the Chandra spectrum at the lowest luminosity level and the XMM-Newton spectra. |
Measurements of the spin period and 0.3–8 keV flux of AX J0049.4−7323 in RXTE observations.
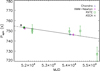 |
Fig. 2 Spin period evolution of AX J0049.4−7323. The black line shows the best-fit long-term spin-up. Error bars indicate 1σ uncertainties. |
3.3 Long-term flux variability
Figure 3 shows the long-term flux history of AX J0049.4−7323, from 2000 April 11 to 2017 March 15, based on Swift/XRT, Chandra, XMM-Newton, RXTE/PCA, INTEGRAL, and ASCA data. Each point, except for INTEGRAL, represents the average 0.3−8 keV flux measured during the different observations. For INTEGRAL, sky images of each pointing were generated in the energy band 20–40 keV. AX J0049.4−7323 was never detected, being below the 5σ threshold ofdetection, in the individual sky images of each pointing. Then, for each INTEGRAL revolution, we combined the individual images to produce mosaic images. As already shown in Coe et al. (2010), AX J0049.4−7323 is detected with a significance of 6.9σ during the INTEGRAL revolution 796, corresponding to the time interval 54 941.368–54 942.975 MJD and orbital phase ϕ =0.992. The 20−40 keV is Fx = (3.8 ± 0.6) × 10−11 erg cm−2 s−1, corresponding to a luminosity of (1.7 ± 0.3) × 1037 erg s−1. AX J0049.4−7323 was never detected in the other revolution-based mosaic images. It has been observed with a long exposure (429 ks) during the periastron passage ~57 316–57 335 MJD. We measured a 20–40 keV3σ flux upper limit of 9.8 × 10⁻¹² erg cm−2 s−1.
For RXTE data, we used Eq. (5) of Yang et al. (2017) to calculate, from each pulsation amplitude and corresponding uncertainty, the 0.3–8 keV flux of the source. We converted the flux from units counts/PCU/s to erg cm−2 s−1 using PIMMS and assuming an absorbed power law model with NH= 4 × 1021 cm−2 and a photon index of 0.8. For the pulsed fraction, we assumed, in accordance with Yang et al. (2017) and the typical values of AX J0049.4−7323 (Hong et al. 2017), pf = 0.4. The RXTE fluxes depend on the spectral and pulsed fraction parameters reported above, which are variable. Therefore, RXTE fluxes could be subject to large uncertainties. By varying the spectral parameters and pf according to Table 3 and Hong et al. (2017) and Haberl et al. (2008), we find that the RXTE fluxes are known with a relative uncertainty of ~50%. Figure 3 shows that RXTE data have a systematically higher flux than the observations from other instruments, also when the relative uncertainties of ~50% of RXTE fluxes are taken into account. This is a selection bias caused by the larger number of RXTE/PCA observations with AX J0049.4−7323 in the field of view (391, Yang et al. 2017) compared to the low number of observations from other telescopes, together with the relatively low sensitivity of RXTE/PCA (flux threshold: ≈ 4 × 10⁻¹² erg cm−2 s−1 in the 2–10 keV energy band; Jahoda et al. 1996). In addition to Swift, XMM-Newton, Chandra, and RXTE, we plotted the ASCA fluxes reported in Yokogawa et al. (2000) and converted to the 0.3−8 keV energy range assuming an absorbed power law spectrum with the parameters found by Yokogawa et al. (2000) during the ASCA observations. INTEGRAL data of Fig. 4 are instead in the 20−40 keV energy range.
AX J0049.4−7323 shows a high X-ray variability, spanning more than three orders of magnitude, from ~ 1.7 × 10⁻¹⁴ erg cm−2 s−1 (corresponding to a luminosity of Lx ~ 8 × 1033 erg s−1 in the energy range 0.3–8 keV) to ~ 3.5 × 10⁻¹¹ erg cm−2 s−1 (Lx ~ 1.6 × 1037 erg s−1). We found that, in addition to ASCA (Coe & Edge 2004), Swift, RXTE, and Chandra also observed AX J0049.4−7323 at orbital phases not coinciding with the periastron during relatively high luminosity states (Lx> 2 × 1035 erg s−1).
Figure 4 shows the X-ray light curve folded at the orbital period of AX J0049.4−7323 (we adopted the ephemeris calculated by Schmidtke et al. 2013). At periastron (0.02 ≲ ϕ ≲ 0.98) the flux is on average higher than elsewhere and varies by a factor of ~4, from Fx ≈ 8 × 10⁻¹² erg cm−2 s−1 (Lx≈ 3.7 × 1036 erg s−1) to Fx ≈ 3.5 × 10⁻¹¹ erg cm−2 s−1 (Lx≈ 1.6 × 1037 erg s−1). Outside theperiastron passage, the maximum variability factor is ≈270, and the flux (luminosity) ranges from Fx ≈ 1.7 × 10⁻¹⁴ erg cm−2 s−1 (Lx≈ 8 × 1033 erg s−1) to Fx ≈ 4.6 × 10⁻¹² erg cm−2 s−1 (Lx≈ 2.1 × 1036 erg s−1). The light curve does not show a sinusoidal modulation. On the contrary, it is characterized (see also Fig. 3) by jumps in luminosity apparently uniformly distributed across the orbit rather than being clustered at some particular orbital phase.
3.4 UVOT
Figure 5 shows the UVOT light curves in four filters (U: 3465 Å; W1: 2600 Å; M2: 2246 Å;W2: 1928 Å) folded at the orbital period (see Sect. 3.3). Clearly, AX J0049.4−7323 is significantly variable in all bands, with amplitudes ΔmU = 0.1, Δ mW1 = 0.16, Δ mM2 = 0.15, and Δ mW2 = 0.07. Unfortunately, the data are too sparse to draw any conclusion about the UV variability along the orbit of AX J0049.4−7323.
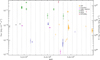 |
Fig. 3 X-ray light curve (0.3–8 keV) of AX J0049.4−7323 obtained from Swift/XRT, Chandra, XMM-Newton, and RXTE data analysed in this work, and ASCA data from Yokogawa et al. (2000). INTEGRAL points are in the energy range 20–40 keV. Downward arrows are used to indicate 3σ upper limits. Grey vertical lines show the times of periastron passages according to the ephemeris calculated by Schmidtke et al. (2013). The right y-axis shows the absorbed 0.3–8 keV X-ray luminosity, assuming d = 62 kpc. Error bars indicate the 1σ uncertainties. |
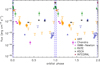 |
Fig. 4 Swift, Chandra, XMM-Newton, and RXTE 0.3–8 keV fluxes folded at the orbital period of AX J0049.4−7323. INTEGRAL points are in the energy range 20–40 keV. Downward arrows are used to indicate 3σ upper limits. Vertical dashed lines and dot-dashed lines show the position of the periastron passages and their uncertainties, respectively. |
4 Discussion
4.1 Secular spin-up
Our data analysis of RXTE data led to a lower number of detections compared to the works of Klus et al. (2014) and Yang et al. (2017). This is due to the highest threshold of detection adopted in our work (99.9% vs. 99%) and to the different data analysis reduction (for the sophisticated data analysis procedure adopted by Klus et al. (2014) and Yang et al. (2017), see Galache et al. 2008). Since we set a higher detection threshold in the Lomb–Scargle analysis, we consider only the strongest signals. Our measurements are thus less contaminated by other signals (e.g. from other pulsars of the SMC in the field of view of AX J0049.4−7323) which couldlead to lower precision and accuracy of the measurements. The improvement obtained by the increase in the detection threshold can be seen in Fig. 2 where the values of the spin periods are less scattered than they are in the plots of Klus et al. (2014) (Fig. B39) and Yang et al. (2017)4.
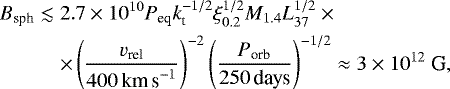
AX J0049.4−7323 shows a long-term spin-up rate of Ṗ = (−3.00 ± 0.12) × 10−3 s day−1, which is more precise than the spin-up rate reported in Yang et al. (2017) [Ṗ = (−4.1 ± 1.6) × 10−3 s day−1]. Such high secular spin-up, when compared with those of other accreting pulsars, indicates that the pulsar of AX J0049.4−7323 is likely far from its equilibrium period. For comparison, the Be/XRB SAX J2103.5+4545 has shown, since its discovery in 1997, a secular spin-up of Ṗ ≈−1.2 × 10⁻³ s day−1 (Camero et al. 2014) and it is believed that it has not yet reached its equilibrium period (Baykal et al. 2002). If the pulsar of AX J0049.4−7323 were in equilibrium, it would be possible to obtain an estimate of its magnetic field strength (see e.g. Klus et al. 2014). Since AX J0049.4−7323 is not in equilibrium, we can just calculate an upper limit for its magnetic field. For this purpose, we used the calculations presented in Ikhsanov (2007) to show that slow pulsars (Pspin ~ 102 − 104 s) in equilibrium do not need supercritical initial magnetic fields of the NS (B ≥ Bcr ≈ 4.4 × 10¹³ G). Adapting the calculations presented for the spherical accretion scenario (see Eq. (8) in Ikhsanov 2007), the maximum magnetic field of AX J0049.4−7323 would be
 (1)
(1)
where kt is a parameter of the order of unity (Ikhsanov 2007; Ikhsanov et al. 2002), M1.4 = MNS∕(1.4 M⊙) is the mass of the NS, L37 = is the X-ray luminosity in units of 1037 erg s−1, vrel is the relative velocity between the NS and the wind from the companion star, and ξ0.2 = ξ∕0.2 is a factor that takes into account the reduction of the angular momentum accretion rate caused by velocity and density inhomogeneities in the accretion flow (see Ikhsanov 2007 and references therein). Since the pulsar of AX J0049.4−7323 is not in equilibrium, we calculated the upper limit Bsph for the conservative case of Peq = 750 s, and we assumed an average luminosity of ~ 4 × 1035 erg s−1. We obtained it from the Swift, Chandra, XMM-Newton, and ASCA observations. We did not consider the RXTE observations because they would introduce a bias due to the relatively low sensitivity of PCA compared to the other three instruments.
Ikhsanov (2007) pointed out that the probability of observing in X-ray a long-period accreting pulsar fed by an accretion disc at a rate of ~ 1015 g s−1 is very low because the accretion disc would spin up the pulsar at a high rate, implying a lifetime of the pulsar during the accretion phase of ≪1000 years, i.e. several orders of magnitude smaller than the typical lifetime of accreting NSs in high-mass X-ray binaries. Therefore, according to Ikhsanov (2007), the accretion disc scenario is unlikely for binary systems similar to AX J0049.4−7323. Nonetheless, we considered here, for completeness, also this case. From Eq. (7) in Ikhsanov (2007), the upper limit of the magnetic field in the accretion disc case would be
 (2)
(2)
where κ0.5 = κ∕0.5 is a parameter that takes into account the geometry of the accretion flow (κ = 0.5 corresponds to disc geometry, while κ = 1 to the spherical geometry). We assumedthe same Peq and L37 of the spherical accretion case.
Spectral parameters and fluxes of the XMM-Newton, Swift, and Chandra observations analysed in this work.
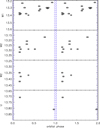 |
Fig. 5 UVOT observations folded at the orbital period of AX J0049.4−7323. Downward arrows are used to indicate 3σ upper limits. Vertical dashed lines and dot-dashed lines show the position of the periastron passages and their uncertainties, respectively. |
4.2 Long-term variability
AX J0049.4−7323 (Figs. 3 and 4) shows an enhanced X-ray luminosity (≈ 1036–1037 erg s−1) at periastron. In a few cases, the source has been detected at high X-ray luminosities (similar to those observed at periastron) across the entire orbit, including orbital phases near to the apastron. Moreover, AX J0049.4−7323 shows a high variability far from periastron, with a maximum variability factor of ~ 270.
The periodic outbursts at periastron displayed by AX J0049.4−7323 are consistent with the definitions of type I outburst given in Sect. 1. In the framework of the truncation disc model, the system is expected to have a high eccentricity to show regular type I outbursts. On the other hand, the strong X-ray variability and high luminosity states observed out of periastron cannot be reconciled with the typical variability of Be/XRBs, traditionally described in terms of type I and type II outbursts. The same conclusion was reached by Coe & Edge (2004) on the basis of three ASCA outbursts (Lx ≈ 1035 erg s−1) observed far from periastron. The anomalous X-ray variability of AX J0049.4−7323 noted by Coe & Edge (2004) is confirmed by the results presented in Sect. 3; it is further complicated when the RXTE detections reported in Yang et al. (2017) and Klus et al. (2014) are taken into account. Figure 6 shows two interesting RXTE detections at ta = 55 262.10 MJD and tb = 55 556.02 MJD (Yang et al. 2017; Klus et al. 2014). Together with the Chandra and Swift detections and upper limits reported in Table 3 and shown in Fig. 6, they constitute two peculiar events characterized by high variability and with timescales t ≪ Porb, located far from periastron. In particular, from ~55 262 MJD (RXTE observation) to ~55 300 MJD (Chandra observations), about 90 days before the periastron passage (ϕorb ≈ 0.8−0.9), the X-ray flux decreased by a factor of ~150 in less than about 38 days. Chandra observed the source five times in the subsequent 18 days. During this period, AX J0049.4−7323 showed a slow increase in flux, from ≈ 4 × 10⁻¹⁴ erg cm−2 s−1 to ≈ 10−13 erg cm−2 s−1. After this X-ray dip caught by Chandra, AX J0049.4−7323 was observed again by RXTE, close to periastron (~55 364 MJD), with a flux of ≈ 4.3 × 10⁻¹² erg cm−2 s−1. Another jump in luminosity was observed in the subsequent orbital cycle, when AX J0049.4−7323 showed an increase in brightness from Fx ≤ 10−13 erg cm−2 s−1 at ~55 542 MJD (Swift/XRT) to Fx ≈ 4 × 10⁻¹² erg cm−2 s−1 at ~55 556 MJD (RXTE, Yang et al. 2017), and then a decrease to Fx ≤ 10−13 erg cm−2 s−1 at ~55 607 MJD (Swift/XRT). The peak luminosity was observed close to apastron (at the orbital phase ~ 0.56). The timescale of the variability and the flux levels are similar to those of the previous event. This variability could be ascribed to multiple short-term outbursts peaking randomly in the orbital phase. Hereafter, we consider two possible mechanisms to explain the observed variability.
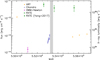 |
Fig. 6 X-ray light curve of AX J0049.4−7323 around the periastron passage at ≈55 340 MJD, showing the RXTE detections reported in Yang et al. (2017) and Klus et al. (2014) (filled green boxes). The grey vertical stripe shows the time of periastron passage according to the ephemeris calculated by Schmidtke et al. (2013). |
4.2.1 Gating mechanism
The decrease in luminosity observed during the events reported in Sect. 3 might be caused by the onset of the centrifugal barrier when the mass inflow rate decreases to a certain limiting value. Transitions from direct accretion to centrifugal inhibition ofaccretion (or propeller, Illarionov & Sunyaev 1975) were proposed by Stella et al. (1986) to explain the high dynamical range, spanning up to six orders of magnitudes, of the X-ray luminosity of some transient Be/XRBs. These transitions depend on the amount of inflowing matter, on the magnetic field strength of the NS and on its spin period. They can be easily understood by introducing the definitions of corotation and magnetospheric radii. The corotation radius (rc) is the distancefrom the NS at which there is a balance between the NS angular velocity and the Keplerian angular velocity. For AX J0049.4−7323 we obtain  cm, where we assumed MNS = 1.4M⊙ and Ps = 750 s. The magnetospheric radius (rm) is the distance from the NS where the magnetic field pressure equals the ram pressure of the accreted ionized plasma dragged along the field lines. If the magnetospheric radius is pushed inside the corotation radius by a sufficiently high amount of inflowing matter, the matter is expected to be effectively accreted by the NS. If the inflowing matter decreases, for example because of small variations inthe wind properties around the NS (density and wind velocity), the magnetospheric radius can expand beyond the corotation radius. In this case, the plasma dragged by the magnetic field lines at the magnetosphere would rotate at a super-Keplerian rate, the magnetosphere would behave as a closed barrier, and direct accretion would be inhibited. According to Stella et al. (1986), the minimum X-ray luminosity caused by direct accretion is obtained assuming rm = rc, and it is given by
 (3)
(3)
where Ṁmin is the minimum mass accretion rate for which the NS accretes directly, R6 = 106 cm is the radius of the NS, M1.4 = 1.4M⊙ is the mass of the neutron star, μ30 = 1030 G cm3 is the NS magnetic moment, and P750 = 750 s is the spin period of AX J0049.4−7323. In Eq. (3) we assumed a 100% efficient conversion of the gravitational potential energy of the accreted matter into X-ray radiation. If we assume that the minimum X-ray luminosity caused by direct accretion is the lowest luminosity observed by XMM-Newton and Chandra when the pulsation was detected (Hong et al. 2017; Haberl et al. 2008), i.e. Lmin ≈ 3 × 1035 erg s−1, from Eq. (3) we find that the pulsar of AX J0049.4−7323 should have a magnetic field strength of ≈ 2.7 × 10¹⁴ G. When the centrifugal barrier becomes active (rm = rc), the maximum allowed luminosity in the propeller regime is given by (see Campana 1997)
 (4)
(4)
which is of the order of 1030 erg s−1 when we assume B ≈ 2.7 × 10¹⁴ G5. The value ofLmax found with Eq. (4) is more than three orders of magnitude lower than the lowest luminosity observed by XMM-Newton in October 2009, Llowest = 8 × 1033 erg s−1. This value of Llowest is about 10–100 times higher than the X-ray luminosity of the brightest known Be stars (Motch et al. 2007), and about 103 times higherthan the X-ray luminosity of typical Be stars. Therefore, the source of this emission is most likely the NS rather than the Be star. The lack of detection of pulsations in the Chandra observations at low luminosity (Sect. 3) might be due to insufficient statistics. To verify this possibility, we performed a timing analysis of the Chandra data at the lowest flux (55 300.9 ≤ t ≤ 55 318.6 MJD) which was not reported in previous works. We used barycentred background subtracted light curves, assuming two different bin sizes: 50 and 100 s. We searchedfor periodicities using the Lomb–Scargle periodogram technique as described in Sect. 3.2. We did not detect any significant (≥3σ) pulsating signal in the data. We performed simulations on the two light curves built with different bin sizes (50 and 100 s) to set a 3σ upper limit on the pulsed fraction of a sinusoidal signal of about 45%. This upper limit is comparable with the typical pulsed fraction of the source detected at higher luminosities (see e.g. Hong et al. 2017). Therefore, we conclude that the transitions from centrifugal inhibition of accretion to direct accretion is unlikely to be responsible for the observed jumps in X-ray luminosity.
4.2.2 Accretion from a cold disc
Another possibility is given by the scenario proposed by Tsygankov et al. (2017). They showed that, after an outburst, a sufficiently slow pulsar in a Be/XRB could switch to an accretion state in which the pulsar is fed by a cold accretion disc. This accretion state is possible if the mass accretion rate is sufficiently high to open the centrifugal barrier (rm < rc) and sufficiently low to have an accretion disc colder than ≈6500 K. The latter condition is verified if6

where B12 = B∕(1012 G). The magnetic field strength of the pulsar in AX J0049.4−7323 is not known. Assuming four test values, B12 = 1012, B13 = 1013, B14 = 1014 G, and B15= 1015 G, we find  erg s−1,
  erg s−1,
  erg s−1, and
  erg s−1. Tsygankov et al. (2017) also noted that the accretion state (cold disc vs. propeller) after an outburst is determined by the spin period and magnetic field strength. Stable accretion from a cold disc, instead of the onset of the propeller regime, is possible if

Assuming again four possible values for the magnetic field strength of the pulsar, we find  s,
s,  s,
s,  s, and
  s. Therefore, the relatively high luminosities of AX J0049.4−7323 observed far from periastron (Lx ≈ 2 × 1035 − 1036 erg s−1) might be caused by stable accretion from a cold accretion disc only if the magnetic field of the pulsar is high, i.e. B ≳ 1014 G. Although magnetic fields of this magnitude are possible in accreting NSs in high-mass X-ray binaries, they should represent rare cases compared to the typical values measured so far (B ≈ 1011−13 G, Revnivtsev & Mereghetti 2015). Therefore, accretion from a cold disc is unlikely to be the reason for the short-term variability at random orbital phases in AX J0049.4−7323.
4.2.3 Perturbed circumstellar disc
If we exclude that the two previous mechanisms are responsible for the high X-ray variability of AX J0049.4−7323, one possibility is that outside the time periods with enhanced X-ray activity (Lx ≥ 1035 erg s−1), AX J0049.4−7323 is a persistent emitter, with luminosity of the order of Llowest. There is a small subclass of Be/XRBs that display persistent X-ray emission at low luminosity levels (Lx ≥ 1034 − 1035 erg s−1) and low X-ray variability (compared to Be/XRB transients; see Reig & Roche 1999 and references therein). AX J0049.4−7323 has some properties in common with the class of persistent Be/XRBs, which also contains slowly rotating NSs (Pspin > 200 s) in wide orbits (Porb > 30 days; Reig 2007, 2011). On the other hand, persistent Be/XRBs have low eccentricities (e < 0.2), at odds with the high eccentricity inferred for AX J0049.4−7323 to explain the outbursts at periastron (see beginning of this section). Nonetheless, we note that another persistent Be/XRB, RX J0440.9+4431 (Porb ≈ 150 days, Pspin ≈ 205 s), rarely showed flaring activity at periastron (peak luminosity Lx ≈ 7.5 × 1036 erg s−1, 2–30 keV; Ferrigno et al. 2013). In this system, the persistent emission (Lx≈ 5 × 1034 erg s−1) might be a consequence of the accretion of the rarefied wind produced by the companion star outside the circumstellar disc, while the flares are related to the accretion at periastron of the dense wind of the circumstellar disc (Ferrigno et al. 2013).
The observed jumps in luminosity might suggest that the material accreted by the NS across the orbit is strongly inhomogeneous, and it is characterized by strong variations in density and stellar wind velocity uncorrelated with the orbital phase. In Sect. 3 we showed that the variability timescales of these jumps is ≲ 37 days. Assuming acircular orbit, an orbital period of 393 days, and masses of the two stars of M* = 18M⊙ (Klus et al. 2014) and MNS = 1.4M⊙, we find that the sizes of the structures responsible for the variability are of the order of 2.5 × 1013 cm. Such large structures encountered by the NS along the orbit might be the result of the tidal interaction of the NS with the circumstellar disc during previous orbital passages. As suggested by Okazaki & Negueruela (2001), in binary systems with very long orbital periods (≳ 200 days), the Be disc might be able to spread out significantly beyond the truncation radius while the NS is far from periastron. Moreover, three-dimensional hydrodynamic simulations have shown that in a systems with a misaligned orbital plane and a circumstellar disc, a warped and eccentric circumstellar disc can develop (Martin et al. 2014). We propose that the disc expansion in AX J0049.4−7323 mright occur not uniformly on the equatorial plane of the Be star, and when the NS crosses the circumstellar disc again, it might accrete large isolated structures characterized by high density and low wind velocity. It is worth noting that GRO J1008−57, another Be/XRB with a long orbital period (~250 days) showed an anomalous variability in 2014/2015, namely three outbursts in a single orbit, with the peak of the third reached at apastron (Kühnel et al. 2017). Kühnel et al. (2017) discussed the peculiar variability of GRO J1008−57 in the framework of misaligned orbital plane and circumstellar disc, with outbursts occurring at the intersection between these two planes. We point out that variability displayed by GRO J1008−57 in 2014/2015, shows some similarities with that observed in AX J0049.4−7323 and presented in this work. Nonetheless, we note that it is difficult to explain the X-ray variability of AX J0049.4−7323 with the scenario proposed for GRO J1008−57. In fact, the high luminosity states of AX J0049.4−7323 observed far from periastron by ASCA, Chandra, and RXTE, always occur at different orbital phases, while the other intersection (at periastron) is constant in phase with time. Such strong variability of the phase at which one of the two intersections occurs would require a warped/tilted or high precessing circumstellar disc.
5 Conclusions and future work
We presented an analysis of archival Swift, Chandra, XMM-Newton, RXTE, and INTEGRAL data of the Be/XRB AX J0049.4−7323. The spectral analysis shows an anti-correlation between the power law slope describing the X-ray continuum and the X-ray flux. This behaviour has been observed in other accreting pulsars in early-type systems (e.g. Reig & Nespoli 2013; Romano et al. 2014; Malacaria et al. 2015).
AX J0049.4−7323 shows a secular spin-up of Ṗ = (−3.00 ± 0.12) × 10−3 s day−1, which suggests that the pulsar has not yet achieved the equilibrium period.
To gain more information about the X-ray properties of AX J0049.4−7323, we studied its long-term X-ray variability, making use of ASCA, Swift, Chandra, XMM-Newton, RXTE, and INTEGRAL data analysed here and in other works. We found that AX J0049.4−7323 shows a high X-ray variability, with high luminosity states (Lx> 5 × 1035 erg s−1) caught by Chandra, Swift, RXTE, and ASCA far from periastron, which suggests that the NS experienced prolonged periods of relatively high accretion rate in different orbital cycles, likely due to the presence of a stable (t ≳1000 days) extended circumstellar disc. Two RXTE detections reported by Yang et al. (2017) and Klus et al. (2014), together with Chandra and Swift data analysed in this work, would indicate two cases of anomalous fast variability far from periastron. If the RXTE detections reported by Yang et al. (2017) and Klus et al. (2014) are not due to spurious effects introduced by statistical fluctuations, we showed that the observed anomalous fast variability discussed in Sect. 3.3 is likely due to complicated tidal interactions of the NS with an extended circumstellar disc. It would be important to observe these flaring events again with future observations. The hypotheses proposed here and in other papers (Coe & Edge 2004) to explain the long-term variability of AX J0049.4−7323 could be verified through a more continuous X-ray monitoring of the source, coupled with simultaneous spectroscopic observationsin optical/UV, especially focused on the study of the long-term variability of emission lines such as Hα. This would provide important information about possible changes of the properties of the circumstellar disc, such as its size and orientation.
Acknowledgements
We thank the anonymous referee for the useful comments that improved the manuscript. L.D. thanks Jun Yang for answering some questions about the library of X-ray pulsars in SMC. This paper is based on data from observationswith, XMM-Newton, Swift, and Chandra X-ray observatory. XMM-Newton is an ESA science mission with instruments and contributions directly funded by ESA Member States and NASA. Chandra data were obtained from the Chandra Data Archive. This paper is based on data from observations with INTEGRAL, an ESA project with instruments and science data centre funded by ESA member states (especially the PI countries: Denmark, France, Germany, Italy, Spain, and Switzerland), Czech Republic, and Poland, and with the participation of Russia and the USA. This work is supported by the Bundesministerium für Wirtschaft und Technologie through the Deutsches Zentrum für Luft und Raumfahrt (grant FKZ 50 OG 1602). P.R. acknowledges contract ASI-INAF I/004/11/0.
References
- Arnaud, K. A. 1996, in Astronomical Data Analysis Software and Systems V, eds. G. H. Jacoby, & J. Barnes, ASP Conf. Ser., 101, 17 [NASA ADS] [Google Scholar]
- Baykal, A., Stark, M. J., & Swank, J. H. 2002, ApJ, 569, 903 [NASA ADS] [CrossRef] [Google Scholar]
- Bozzo, E., Stella, L., Vietri, M., & Ghosh, P. 2009, A&A, 493, 809 [NASA ADS] [CrossRef] [EDP Sciences] [Google Scholar]
- Burrows, D. N., Hill, J. E., Nousek, J. A., et al. 2005, Space Sci. Rev., 120, 165 [NASA ADS] [CrossRef] [Google Scholar]
- Camero, A., Zurita, C., Gutiérrez-Soto, J., et al. 2014, A&A, 568, A115 [NASA ADS] [CrossRef] [EDP Sciences] [Google Scholar]
- Campana, S. 1997, A&A, 320, 840 [NASA ADS] [Google Scholar]
- Cash, W. 1979, ApJ, 228, 939 [NASA ADS] [CrossRef] [Google Scholar]
- Coe, M. J., & Edge, W. R. T. 2004, MNRAS, 350, 756 [NASA ADS] [CrossRef] [Google Scholar]
- Coe, M. J., Bird, A. J., Buckley, D. A. H., et al. 2010, MNRAS, 406, 2533 [NASA ADS] [CrossRef] [Google Scholar]
- Cowley, A. P., & Schmidtke, P. C. 2003, AJ, 126, 2949 [NASA ADS] [CrossRef] [Google Scholar]
- Dickey, J. M., & Lockman, F. J. 1990, ARA&A, 28, 215 [NASA ADS] [CrossRef] [MathSciNet] [Google Scholar]
- Edge, W. R. T., & Coe, M. J. 2003, MNRAS, 338, 428 [NASA ADS] [CrossRef] [Google Scholar]
- Ferrigno, C., Farinelli, R., Bozzo, E., et al. 2013, A&A, 553, A103 [NASA ADS] [CrossRef] [EDP Sciences] [Google Scholar]
- Galache, J. L., Corbet, R. H. D., Coe, M. J., et al. 2008, ApJS, 177, 189 [NASA ADS] [CrossRef] [Google Scholar]
- Gehrels, N., Chincarini, G., Giommi, P., et al. 2004, ApJ, 611, 1005 [NASA ADS] [CrossRef] [Google Scholar]
- Glotfelty, K. 2014, in 15 Years of Science with Chandra, Posters from the Chandra Science Symposium, P21 [Google Scholar]
- Haberl, F., & Pietsch, W. 2004, A&A, 414, 667 [NASA ADS] [CrossRef] [EDP Sciences] [Google Scholar]
- Haberl, F., Eger, P., & Pietsch, W. 2008, A&A, 489, 327 [NASA ADS] [CrossRef] [EDP Sciences] [Google Scholar]
- Hong, J., Antoniou, V., Zezas, A., et al. 2017, ApJ, 847, 26 [NASA ADS] [CrossRef] [Google Scholar]
- Horne, J. H., & Baliunas, S. L. 1986, ApJ, 302, 757 [NASA ADS] [CrossRef] [Google Scholar]
- Ikhsanov, N. R. 2007, MNRAS, 375, 698 [NASA ADS] [CrossRef] [Google Scholar]
- Ikhsanov, N. R., Jordan, S., & Beskrovnaya, N. G. 2002, A&A, 385, 152 [NASA ADS] [CrossRef] [EDP Sciences] [Google Scholar]
- Illarionov, A. F., & Sunyaev, R. A. 1975, A&A, 39, 185 [NASA ADS] [Google Scholar]
- Jahoda, K., Swank, J. H., Giles, A. B., et al. 1996, in EUV, X-Ray, and Gamma-Ray Instrumentation for Astronomy VII, eds. O. H. Siegmund, & M. A. Gummin, Proc. SPIE, 2808, 59 [NASA ADS] [CrossRef] [Google Scholar]
- Kalberla, P. M. W., Burton, W. B., Hartmann, D., et al. 2005, A&A, 440, 775 [NASA ADS] [CrossRef] [EDP Sciences] [Google Scholar]
- Kennea, J. A., Evans, P. A., & Coe, M. J. 2016, ATel, 9299 [Google Scholar]
- Klus, H., Ho, W. C. G., Coe, M. J., Corbet, R. H. D., & Townsend, L. J. 2014, MNRAS, 437, 3863 [NASA ADS] [CrossRef] [Google Scholar]
- Kraft, R. P., Burrows, D. N., & Nousek, J. A. 1991, ApJ, 374, 344 [NASA ADS] [CrossRef] [Google Scholar]
- Kühnel, M., Fürst, F., Pottschmidt, K., et al. 2017, A&A, 607, A88 [NASA ADS] [CrossRef] [EDP Sciences] [Google Scholar]
- Laycock, S., Corbet, R. H. D., Coe, M. J., et al. 2005, ApJS, 161, 96 [NASA ADS] [CrossRef] [Google Scholar]
- Lebrun, F., Leray, J. P., Lavocat, P., et al. 2003, A&A, 411, L141 [NASA ADS] [CrossRef] [EDP Sciences] [Google Scholar]
- Malacaria, C., Klochkov, D., Santangelo, A., & Staubert, R. 2015, A&A, 581, A121 [NASA ADS] [CrossRef] [EDP Sciences] [Google Scholar]
- Martin, R. G., Nixon, C., Armitage, P. J., Lubow, S. H., & Price, D. J. 2014, ApJ, 790, L34 [NASA ADS] [CrossRef] [Google Scholar]
- McBride, V. A., Coe, M. J., Negueruela, I., Schurch, M. P. E., & McGowan, K. E. 2008, MNRAS, 388, 1198 [NASA ADS] [CrossRef] [Google Scholar]
- Motch, C., Lopes de Oliveira, R., Negueruela, I., Haberl, F., & Janot-Pacheco, E. 2007, in Active OB-Stars: Laboratories for Stellar and Circumstellar Physics, eds. A. T. Okazaki, S. P. Owocki, & S. Stefl, ASP Conf. Ser., 361 [Google Scholar]
- Negueruela, I.,& Okazaki, A. T. 2001, A&A, 369, 108 [NASA ADS] [CrossRef] [EDP Sciences] [Google Scholar]
- Okazaki, A. T., & Negueruela, I. 2001, A&A, 377, 161 [NASA ADS] [CrossRef] [EDP Sciences] [Google Scholar]
- Press, W. H., & Rybicki, G. B. 1989, ApJ, 338, 277 [NASA ADS] [CrossRef] [Google Scholar]
- Reig, P. 2007, MNRAS, 377, 867 [NASA ADS] [CrossRef] [Google Scholar]
- Reig, P. 2011, Ap&SS, 332, 1 [NASA ADS] [CrossRef] [Google Scholar]
- Reig, P., & Nespoli, E. 2013, A&A, 551, A1 [NASA ADS] [CrossRef] [EDP Sciences] [Google Scholar]
- Reig, P., & Roche, P. 1999, MNRAS, 306, 100 [NASA ADS] [CrossRef] [Google Scholar]
- Revnivtsev, M., & Mereghetti, S. 2015, Space Sci. Rev., 191, 293 [NASA ADS] [CrossRef] [Google Scholar]
- Romano, P., Ducci, L., Mangano, V., et al. 2014, A&A, 568, A55 [NASA ADS] [CrossRef] [EDP Sciences] [Google Scholar]
- Roming, P. W. A., Kennedy, T. E., Mason, K. O., et al. 2005, Space Sci. Rev., 120, 95 [NASA ADS] [CrossRef] [Google Scholar]
- Schmidtke, P. C., Cowley, A. P., & Udalski, A. 2013, MNRAS, 431, 252 [NASA ADS] [CrossRef] [Google Scholar]
- Stella, L., White, N. E., & Rosner, R. 1986, ApJ, 308, 669 [NASA ADS] [CrossRef] [Google Scholar]
- Tsygankov, S. S., Mushtukov, A. A., Suleimanov, V. F., et al. 2017, A&A, 608, A17 [NASA ADS] [CrossRef] [EDP Sciences] [Google Scholar]
- Ubertini, P., Lebrun, F., Di Cocco, G., et al. 2003, A&A, 411, L131 [NASA ADS] [CrossRef] [EDP Sciences] [Google Scholar]
- Ueno, M., Yokogawa, J., Imanishi, K., & Koyama, K. 2000, IAU Circ., 7442, 3 [NASA ADS] [Google Scholar]
- Yang, J., Laycock, S. G. T., Christodoulou, D. M., et al. 2017, ApJ, 839, 119 [NASA ADS] [CrossRef] [Google Scholar]
- Yokogawa, J., Imanishi, K., Ueno, M., & Koyama, K. 2000, PASJ, 52, L73 [NASA ADS] [Google Scholar]
At larger off-axis angle the response is not well known. See the INTEGRAL data analysis documentation: http://www.isdc.unige.ch/integral/analysis#Documentation
The approximated Eq. (2) for the calculation of the magnetospheric radius in Stella et al. (1986) might lead to overestimating it, as discussed in Bozzo et al. (2009). Therefore, the values given in Eqs. (3) and (4) have to be taken with caution, and could be affected by an uncertainty of a factor of a few.
Tsygankov et al. (2017) presented accurate conditions to have accretion from a cold disc (see their Eqs. (12) and (13)). However, due to the lack of enough information for AX J0049.4−7323, we use here the simplified conditions, based on the assumption that the temperature of the accretion disc reaches its maximum at the inner radius (see Eqs. (6) and (7) in Tsygankov et al. 2017).
All Tables
Measurements of the spin period and 0.3–8 keV flux of AX J0049.4−7323 in RXTE observations.
Spectral parameters and fluxes of the XMM-Newton, Swift, and Chandra observations analysed in this work.
All Figures
|
Fig. 1 Top panel: column density and photon index as a function of the absorbed flux (errors quoted at 1σ c.l.). Theplotted values correspond to those listed in Table 3. The anti-correlation Γ vs. flux is emphasized by the dot-dashed line, which shows the best linear fit (Γ vs. log 10 Fx). Bottom panel: confidence contours at 68%, 95%, and 99% in the NH −Γ plane of the Chandra spectrum at the lowest luminosity level and the XMM-Newton spectra. |
| In the text | |
|
Fig. 2 Spin period evolution of AX J0049.4−7323. The black line shows the best-fit long-term spin-up. Error bars indicate 1σ uncertainties. |
| In the text | |
|
Fig. 3 X-ray light curve (0.3–8 keV) of AX J0049.4−7323 obtained from Swift/XRT, Chandra, XMM-Newton, and RXTE data analysed in this work, and ASCA data from Yokogawa et al. (2000). INTEGRAL points are in the energy range 20–40 keV. Downward arrows are used to indicate 3σ upper limits. Grey vertical lines show the times of periastron passages according to the ephemeris calculated by Schmidtke et al. (2013). The right y-axis shows the absorbed 0.3–8 keV X-ray luminosity, assuming d = 62 kpc. Error bars indicate the 1σ uncertainties. |
| In the text | |
|
Fig. 4 Swift, Chandra, XMM-Newton, and RXTE 0.3–8 keV fluxes folded at the orbital period of AX J0049.4−7323. INTEGRAL points are in the energy range 20–40 keV. Downward arrows are used to indicate 3σ upper limits. Vertical dashed lines and dot-dashed lines show the position of the periastron passages and their uncertainties, respectively. |
| In the text | |
|
Fig. 5 UVOT observations folded at the orbital period of AX J0049.4−7323. Downward arrows are used to indicate 3σ upper limits. Vertical dashed lines and dot-dashed lines show the position of the periastron passages and their uncertainties, respectively. |
| In the text | |
|
Fig. 6 X-ray light curve of AX J0049.4−7323 around the periastron passage at ≈55 340 MJD, showing the RXTE detections reported in Yang et al. (2017) and Klus et al. (2014) (filled green boxes). The grey vertical stripe shows the time of periastron passage according to the ephemeris calculated by Schmidtke et al. (2013). |
| In the text | |
Current usage metrics show cumulative count of Article Views (full-text article views including HTML views, PDF and ePub downloads, according to the available data) and Abstracts Views on Vision4Press platform.
Data correspond to usage on the plateform after 2015. The current usage metrics is available 48-96 hours after online publication and is updated daily on week days.
Initial download of the metrics may take a while.