Fig. 1
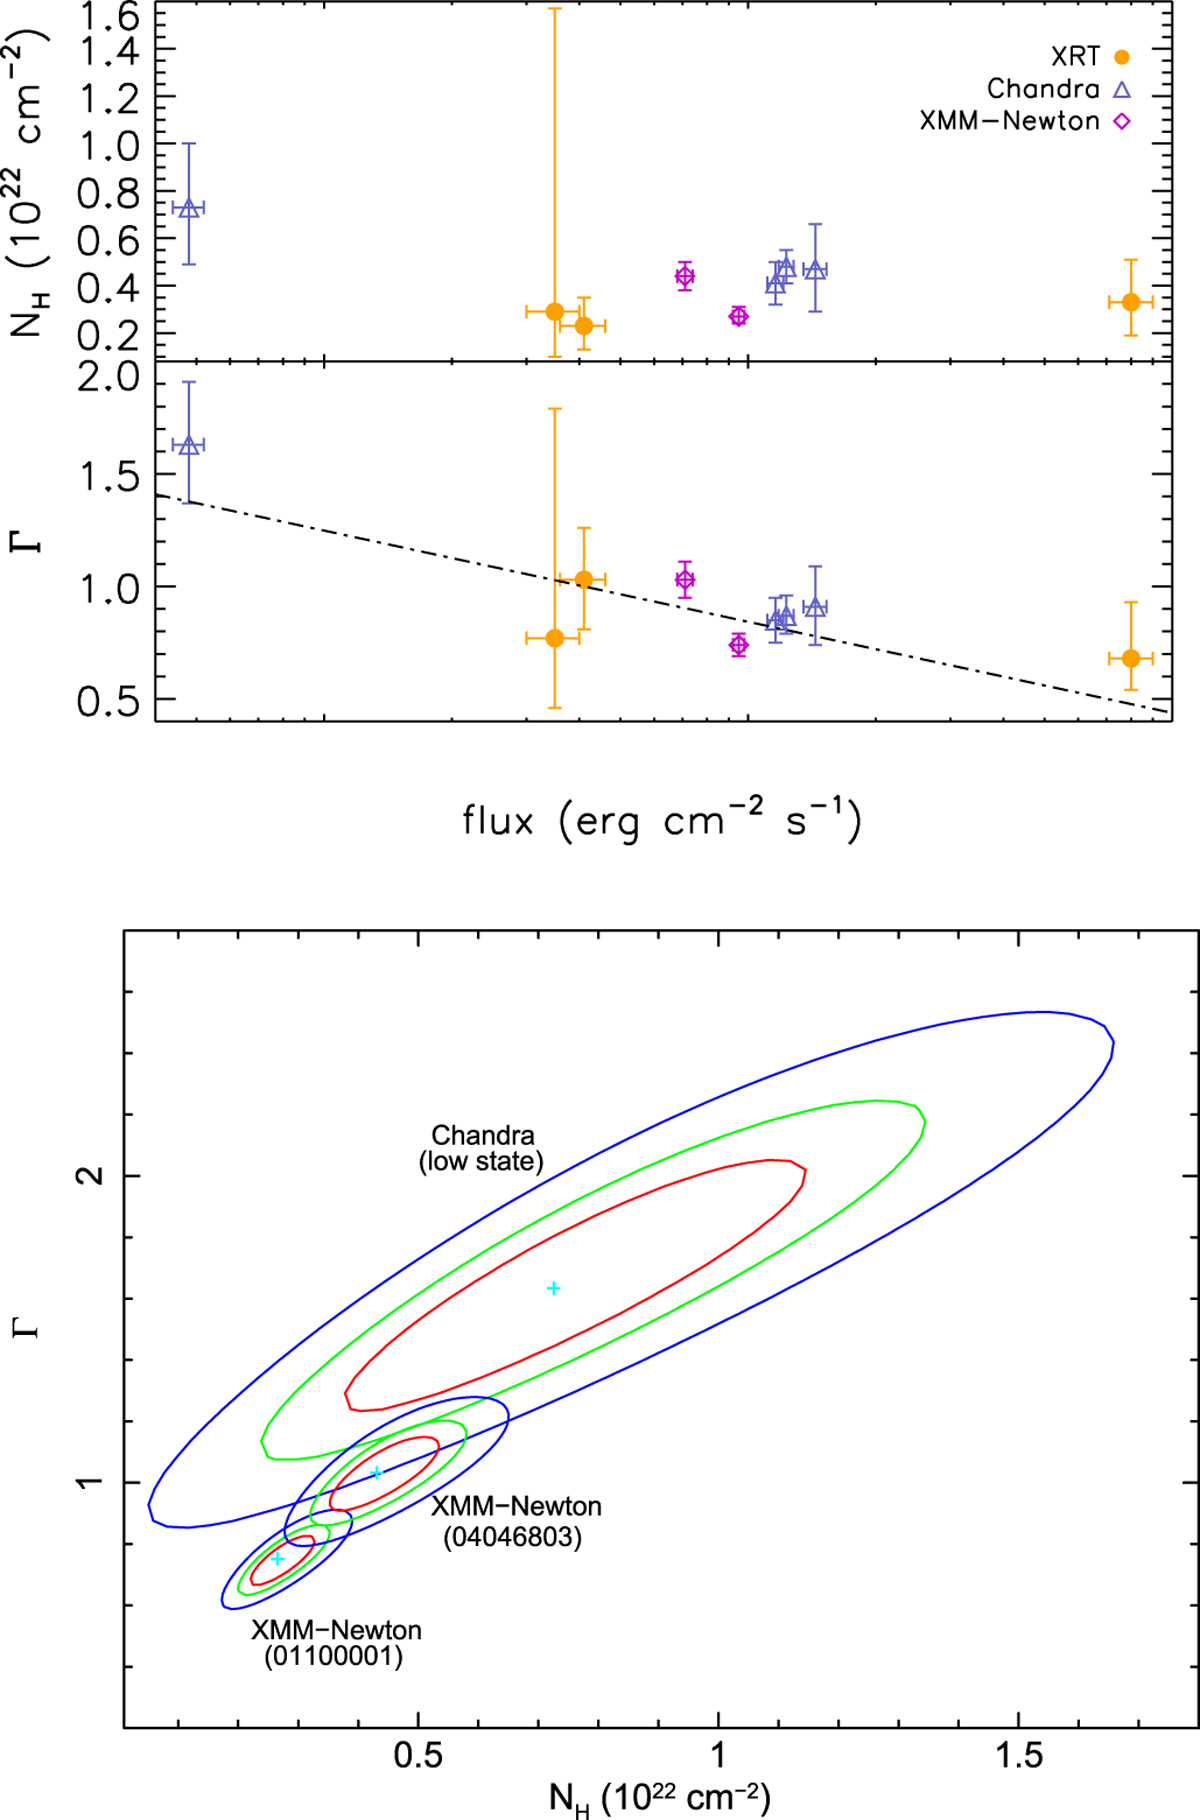
Top panel: column density and photon index as a function of the absorbed flux (errors quoted at 1σ c.l.). Theplotted values correspond to those listed in Table 3. The anti-correlation Γ vs. flux is emphasized by the dot-dashed line, which shows the best linear fit (Γ vs. log 10 Fx). Bottom panel: confidence contours at 68%, 95%, and 99% in the NH −Γ plane of the Chandra spectrum at the lowest luminosity level and the XMM-Newton spectra.
Current usage metrics show cumulative count of Article Views (full-text article views including HTML views, PDF and ePub downloads, according to the available data) and Abstracts Views on Vision4Press platform.
Data correspond to usage on the plateform after 2015. The current usage metrics is available 48-96 hours after online publication and is updated daily on week days.
Initial download of the metrics may take a while.