Fig. 3
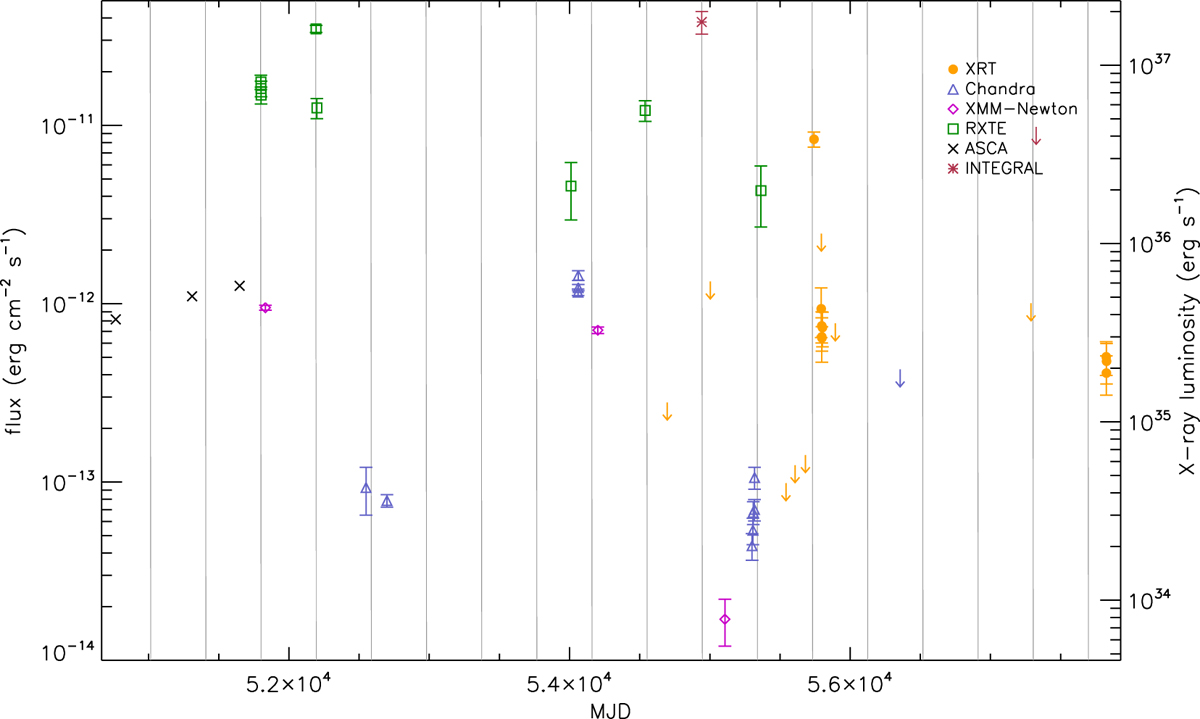
X-ray light curve (0.3–8 keV) of AX J0049.4−7323 obtained from Swift/XRT, Chandra, XMM-Newton, and RXTE data analysed in this work, and ASCA data from Yokogawa et al. (2000). INTEGRAL points are in the energy range 20–40 keV. Downward arrows are used to indicate 3σ upper limits. Grey vertical lines show the times of periastron passages according to the ephemeris calculated by Schmidtke et al. (2013). The right y-axis shows the absorbed 0.3–8 keV X-ray luminosity, assuming d = 62 kpc. Error bars indicate the 1σ uncertainties.
Current usage metrics show cumulative count of Article Views (full-text article views including HTML views, PDF and ePub downloads, according to the available data) and Abstracts Views on Vision4Press platform.
Data correspond to usage on the plateform after 2015. The current usage metrics is available 48-96 hours after online publication and is updated daily on week days.
Initial download of the metrics may take a while.