Fig. 9
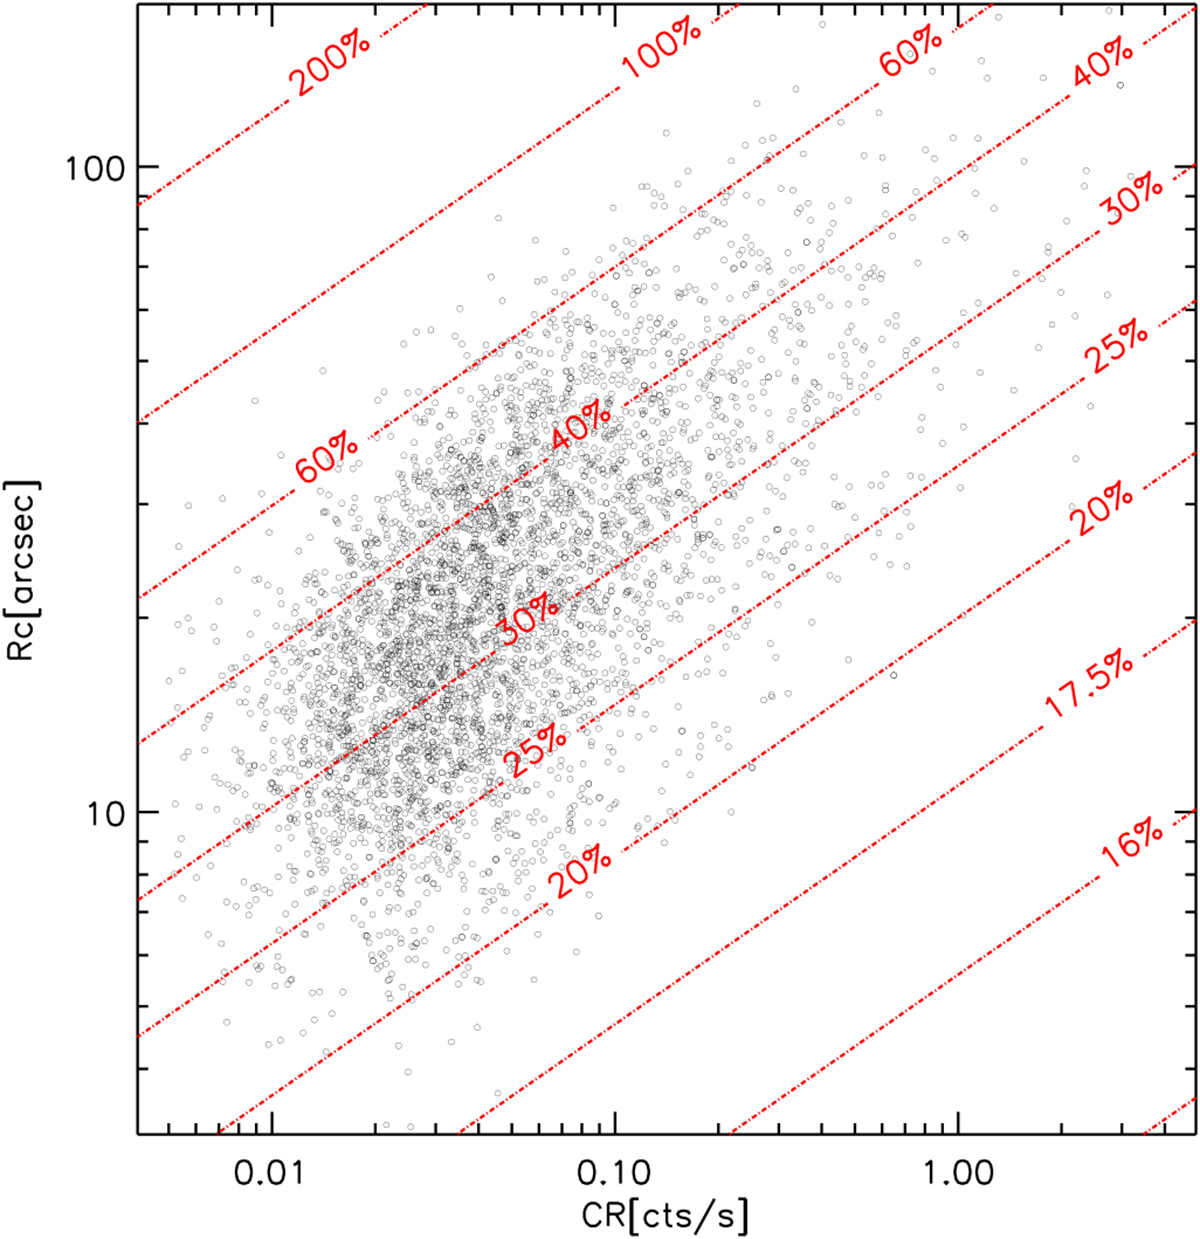
Red lines show the adopted measurement error model as a function of the nominal total [0.5–2] keV CR and apparent rc; the black circles are the detected Aardvark C1 clusters, drawn to highlight the cluster locus in this parameter space. Practically, the error on CR and rc are randomly ascribed from a log-normal distribution with the dispersion given by the red abacuses. Errors on HR1 and HR2 are assumed to be respectively the same and the double values obtained for the corresponding [CR, rc] combination. The model assumes a mean vignetting value.
Current usage metrics show cumulative count of Article Views (full-text article views including HTML views, PDF and ePub downloads, according to the available data) and Abstracts Views on Vision4Press platform.
Data correspond to usage on the plateform after 2015. The current usage metrics is available 48-96 hours after online publication and is updated daily on week days.
Initial download of the metrics may take a while.