Fig. 6
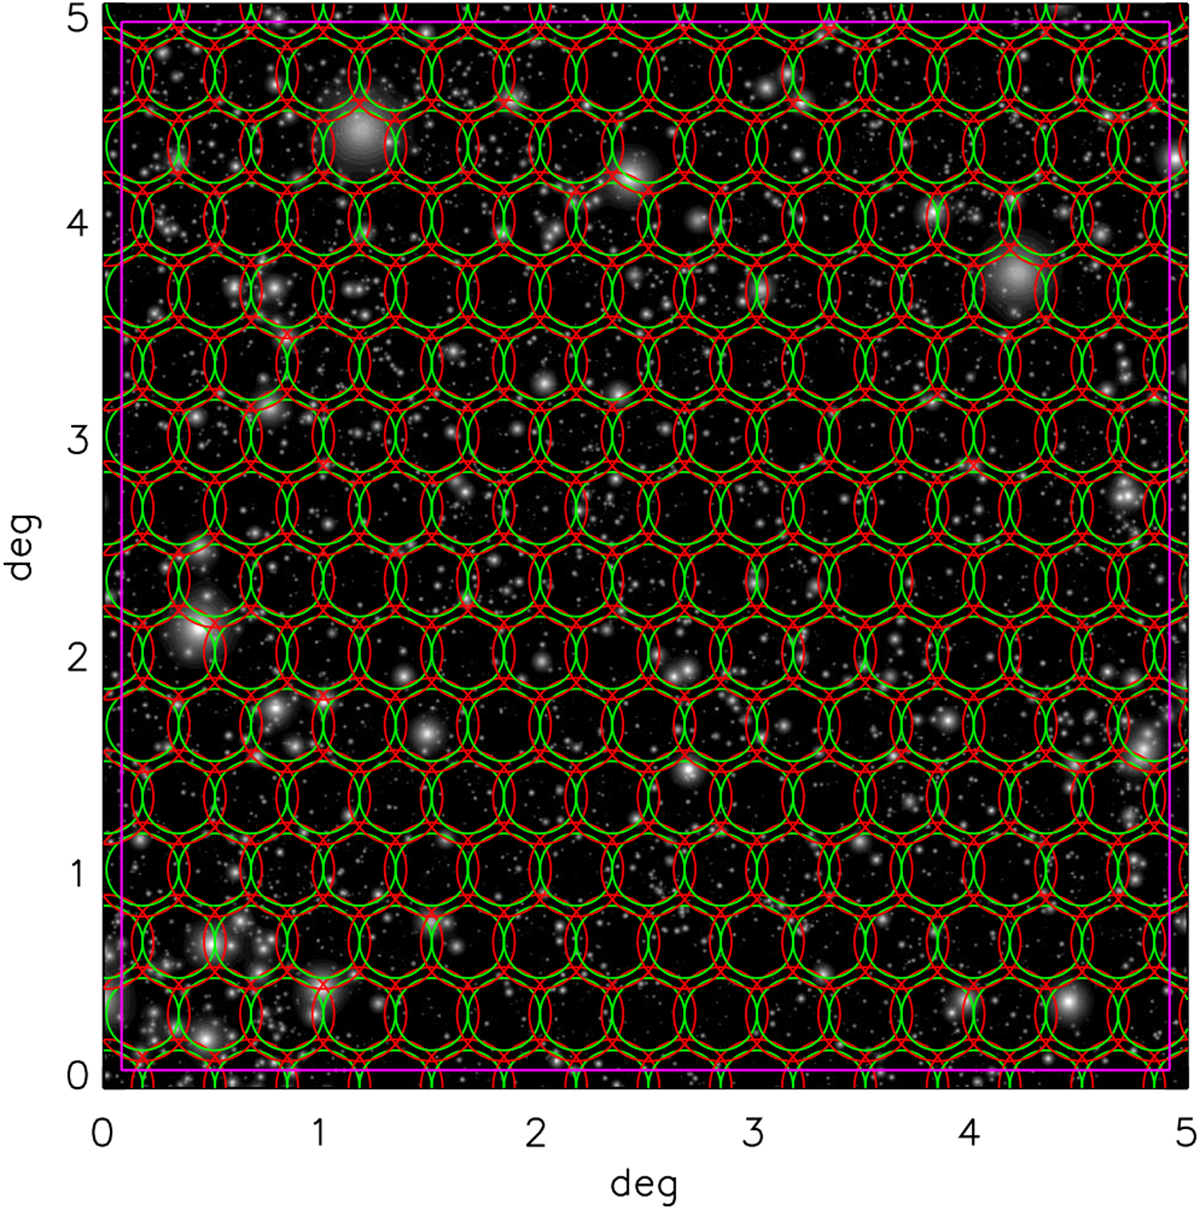
Layout of the XMM pointings over a single 25 deg2 region; the observations are separated by 10′ in RA and Dec. Source detection is performed out to a radius of 13′ (red circles). For the cosmological analysis only sources in the innermost 10′ are considered (green circles). To avoid border effects, we discarded all detections outside the magenta square.
Current usage metrics show cumulative count of Article Views (full-text article views including HTML views, PDF and ePub downloads, according to the available data) and Abstracts Views on Vision4Press platform.
Data correspond to usage on the plateform after 2015. The current usage metrics is available 48-96 hours after online publication and is updated daily on week days.
Initial download of the metrics may take a while.