Fig. 4
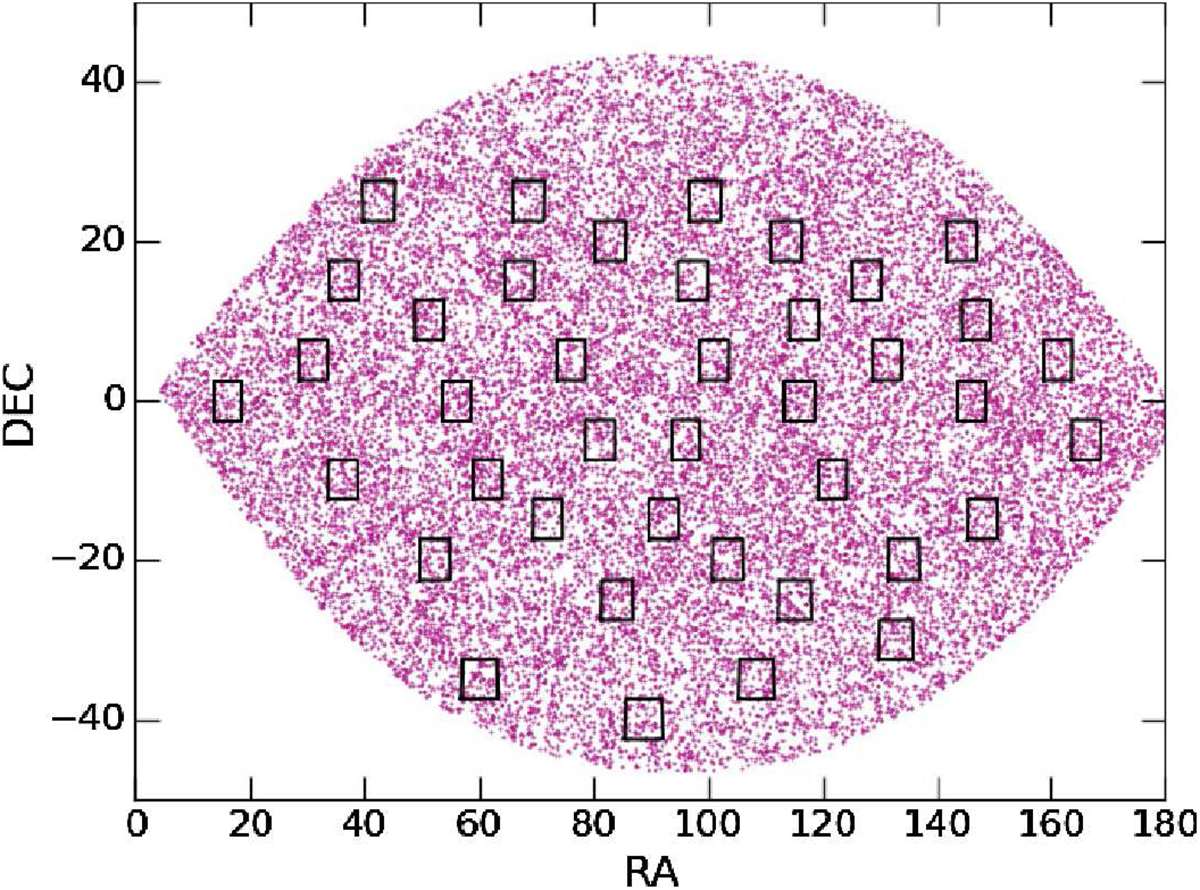
Sky maps of the 39 regions extracted from the Aardvark simulations. Each square covers 25 deg2. Magenta dots show all haloes with a mass larger than 1014 M⊙. The simulation depth is 0 < z < 2.
Current usage metrics show cumulative count of Article Views (full-text article views including HTML views, PDF and ePub downloads, according to the available data) and Abstracts Views on Vision4Press platform.
Data correspond to usage on the plateform after 2015. The current usage metrics is available 48-96 hours after online publication and is updated daily on week days.
Initial download of the metrics may take a while.