Fig. 3
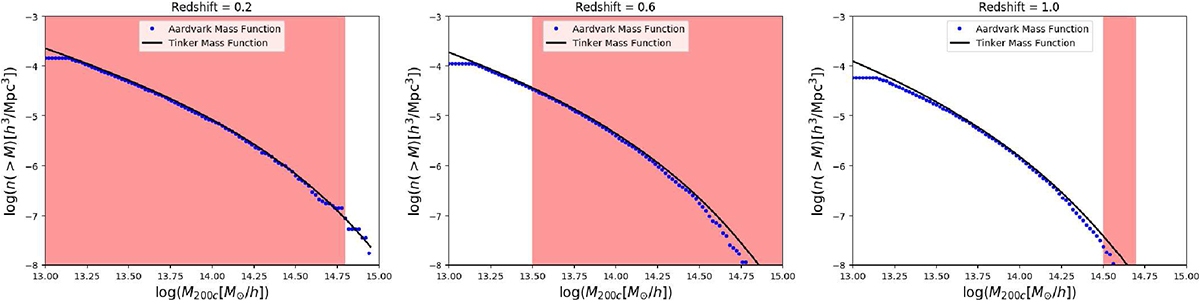
Cumulative dark matter halo number density as a function of mass at different epochs. Blue dots show Aardvark simulations. The pink areas show the mass range encompassed by the C1 selection. The mass scale of 1013.2 M⊙ represents the halo mass resolution limit of the simulations.
Current usage metrics show cumulative count of Article Views (full-text article views including HTML views, PDF and ePub downloads, according to the available data) and Abstracts Views on Vision4Press platform.
Data correspond to usage on the plateform after 2015. The current usage metrics is available 48-96 hours after online publication and is updated daily on week days.
Initial download of the metrics may take a while.