Fig. 14
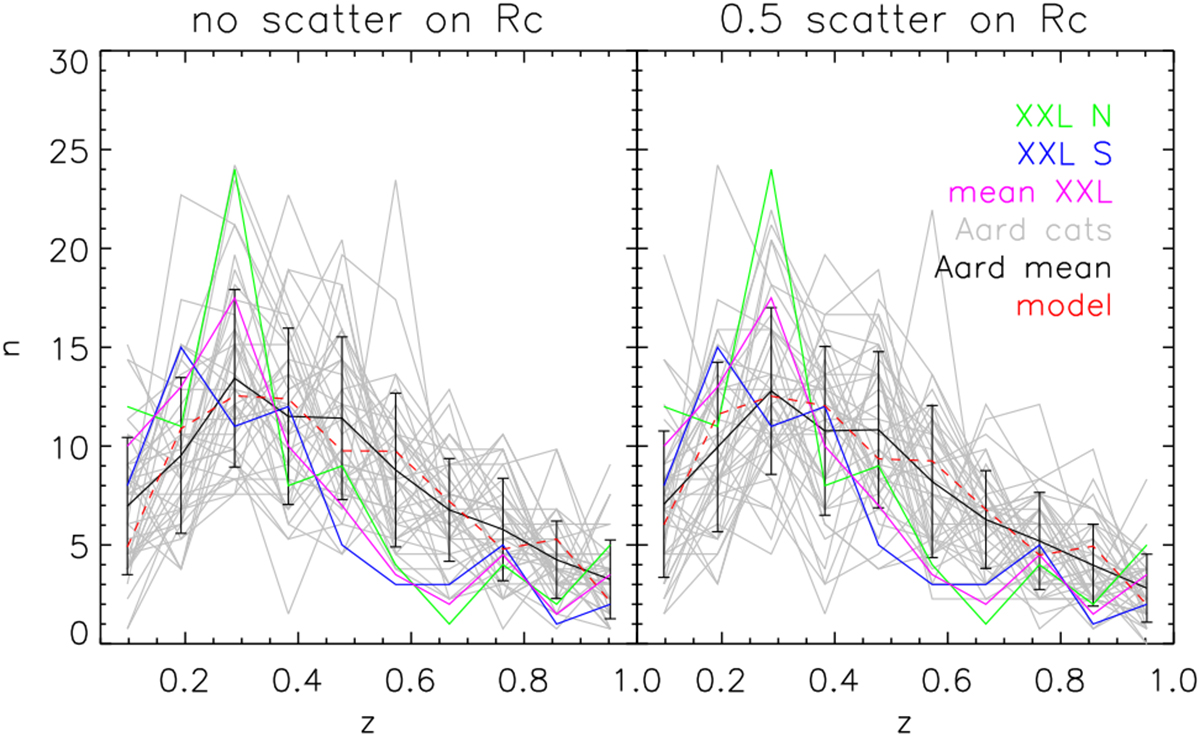
Redshift distribution of the detected C1 Aardvark clusters for the for B0 (left) and B0.5 (right) profile configurations. Grey lines show the cluster selected population and correspond each to 18.22 deg2 map. The black dash-dotted line stands for the mean and the error bars show the 1σ deviation. The red dashed line shows our fiducial model (X-ray mapping of the haloes + analytical selection). All distributions are normalised to 13.8 deg2 to match the effective area of the XXL northern (green solid) and XXL southern (blue solid) fields considering only the pointing innermost 10′ (XXL PaperXX, Adami et al. 2018). The mean of the two XXL fields is in magenta.
Current usage metrics show cumulative count of Article Views (full-text article views including HTML views, PDF and ePub downloads, according to the available data) and Abstracts Views on Vision4Press platform.
Data correspond to usage on the plateform after 2015. The current usage metrics is available 48-96 hours after online publication and is updated daily on week days.
Initial download of the metrics may take a while.