Fig. 12
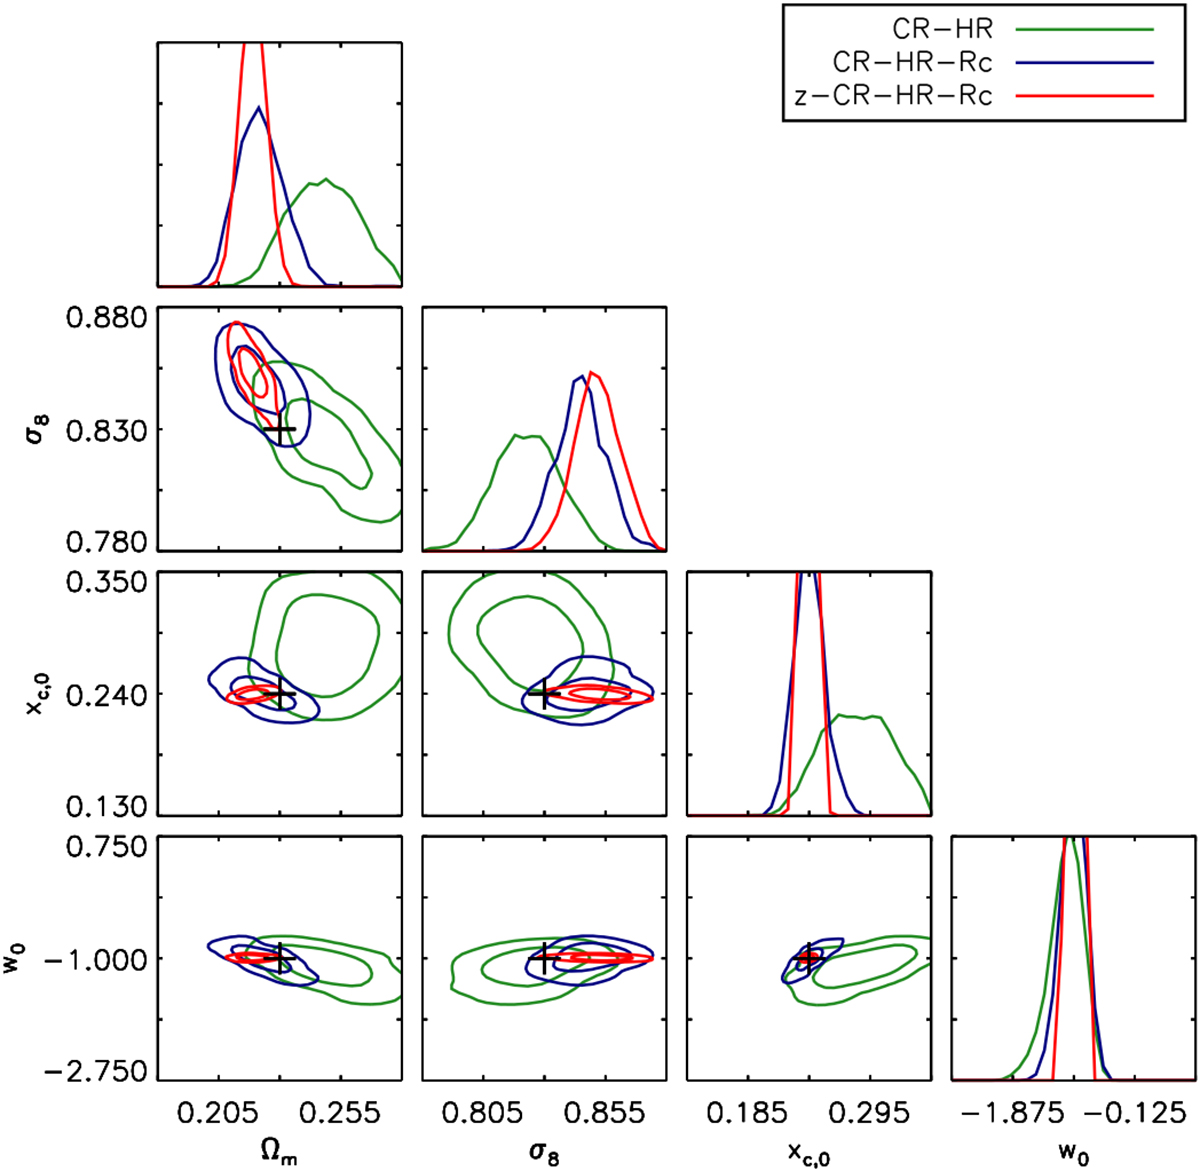
Confidence regions at the 68% and 95% levels and 1D marginalised distribution for the studied parameter subset (Ωm, σ8, xc, w0). The cross indicates the fiducial model. The MCMC analysis was run on an effective sky area of 711 deg2 for the CLEAN C1 catalogue, involving some 4300 clusters. Fit for z−CR-HR-rc is shown in red, for CR-HR-rc is shown in blue, and for CR-HR in green.
Current usage metrics show cumulative count of Article Views (full-text article views including HTML views, PDF and ePub downloads, according to the available data) and Abstracts Views on Vision4Press platform.
Data correspond to usage on the plateform after 2015. The current usage metrics is available 48-96 hours after online publication and is updated daily on week days.
Initial download of the metrics may take a while.