Fig. 10
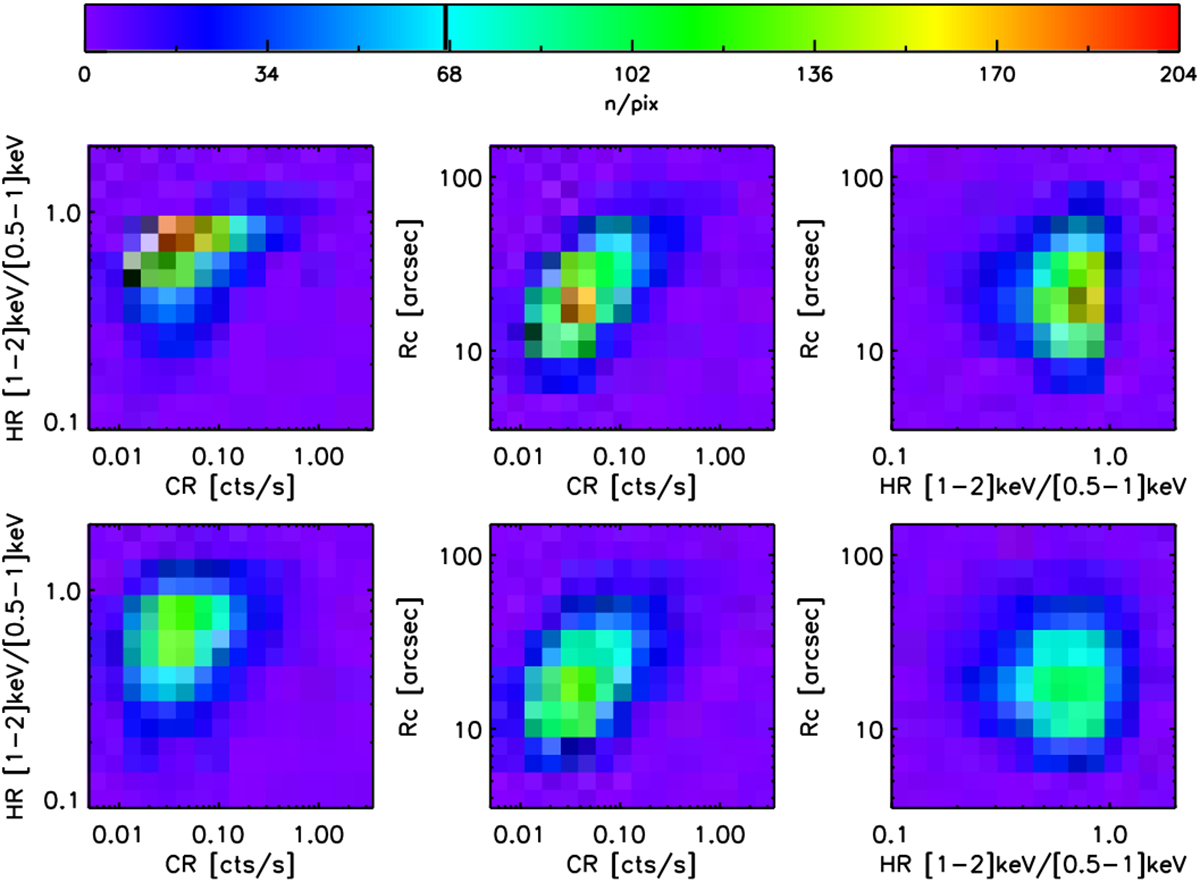
Effects of measurement errors on the C1 CLEAN sample. The plots show from left to right the 2D diagrams CR-HR, CR-rc, and HR-rc. The first rowstands for the nominal CR, HR, and rc values stored in the Aardvark catalogues. The second row shows the result of the implementation of the error model displayed in Fig. 9.
Current usage metrics show cumulative count of Article Views (full-text article views including HTML views, PDF and ePub downloads, according to the available data) and Abstracts Views on Vision4Press platform.
Data correspond to usage on the plateform after 2015. The current usage metrics is available 48-96 hours after online publication and is updated daily on week days.
Initial download of the metrics may take a while.