Fig. 1
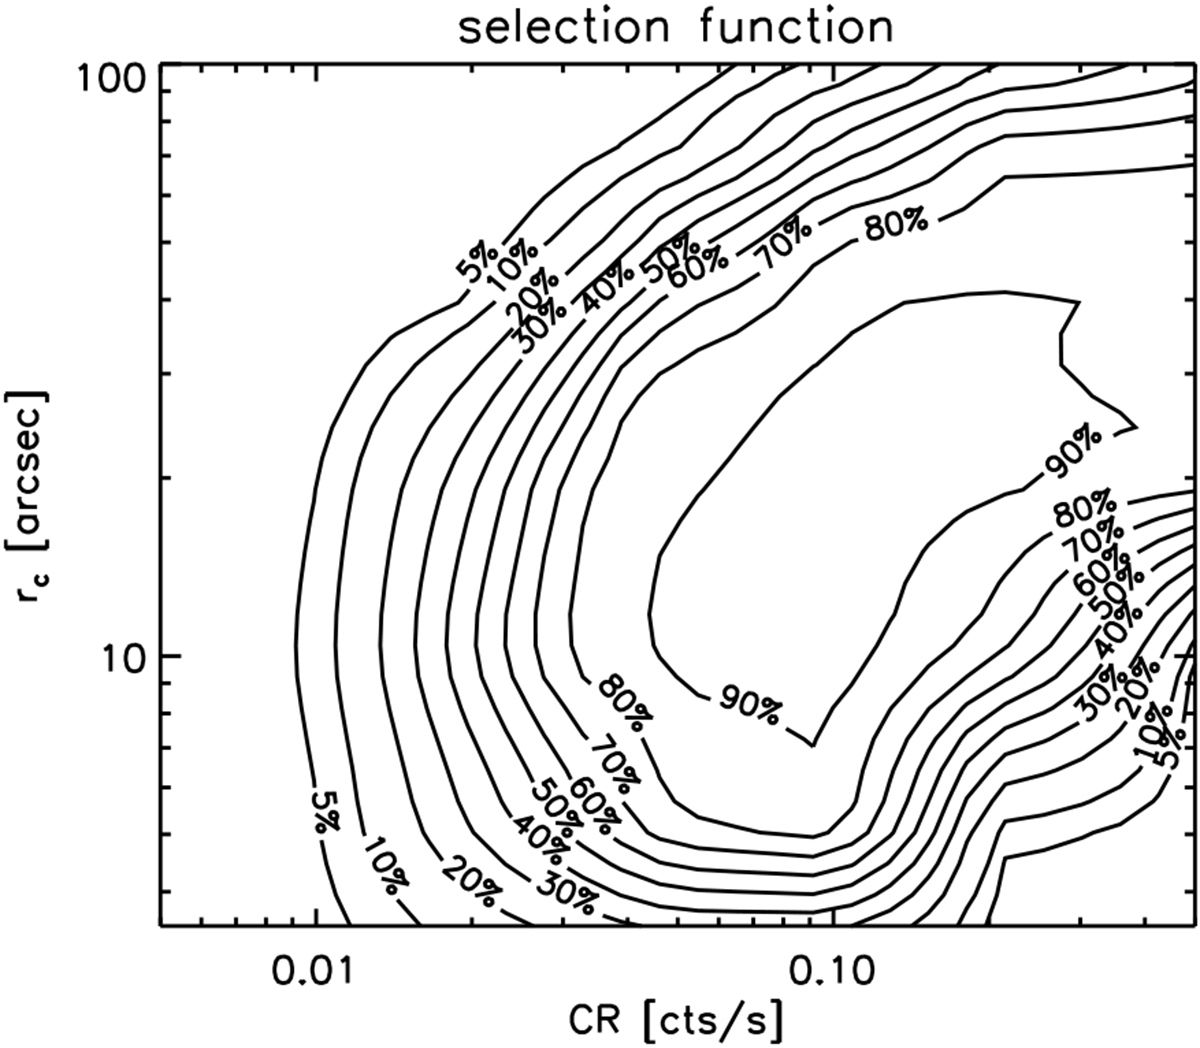
Selection function adopted for the present study. The probability to detect a cluster as C1 is given by the isocontours as a function of CR and rc. This map was derived from extensive XMM image simulations and the two axes stand for the true (input) cluster parameters; it is thus only valid for the conditions under which the simulations were run (XMM exposure time of 10 ks and background).
Current usage metrics show cumulative count of Article Views (full-text article views including HTML views, PDF and ePub downloads, according to the available data) and Abstracts Views on Vision4Press platform.
Data correspond to usage on the plateform after 2015. The current usage metrics is available 48-96 hours after online publication and is updated daily on week days.
Initial download of the metrics may take a while.