Fig. 4
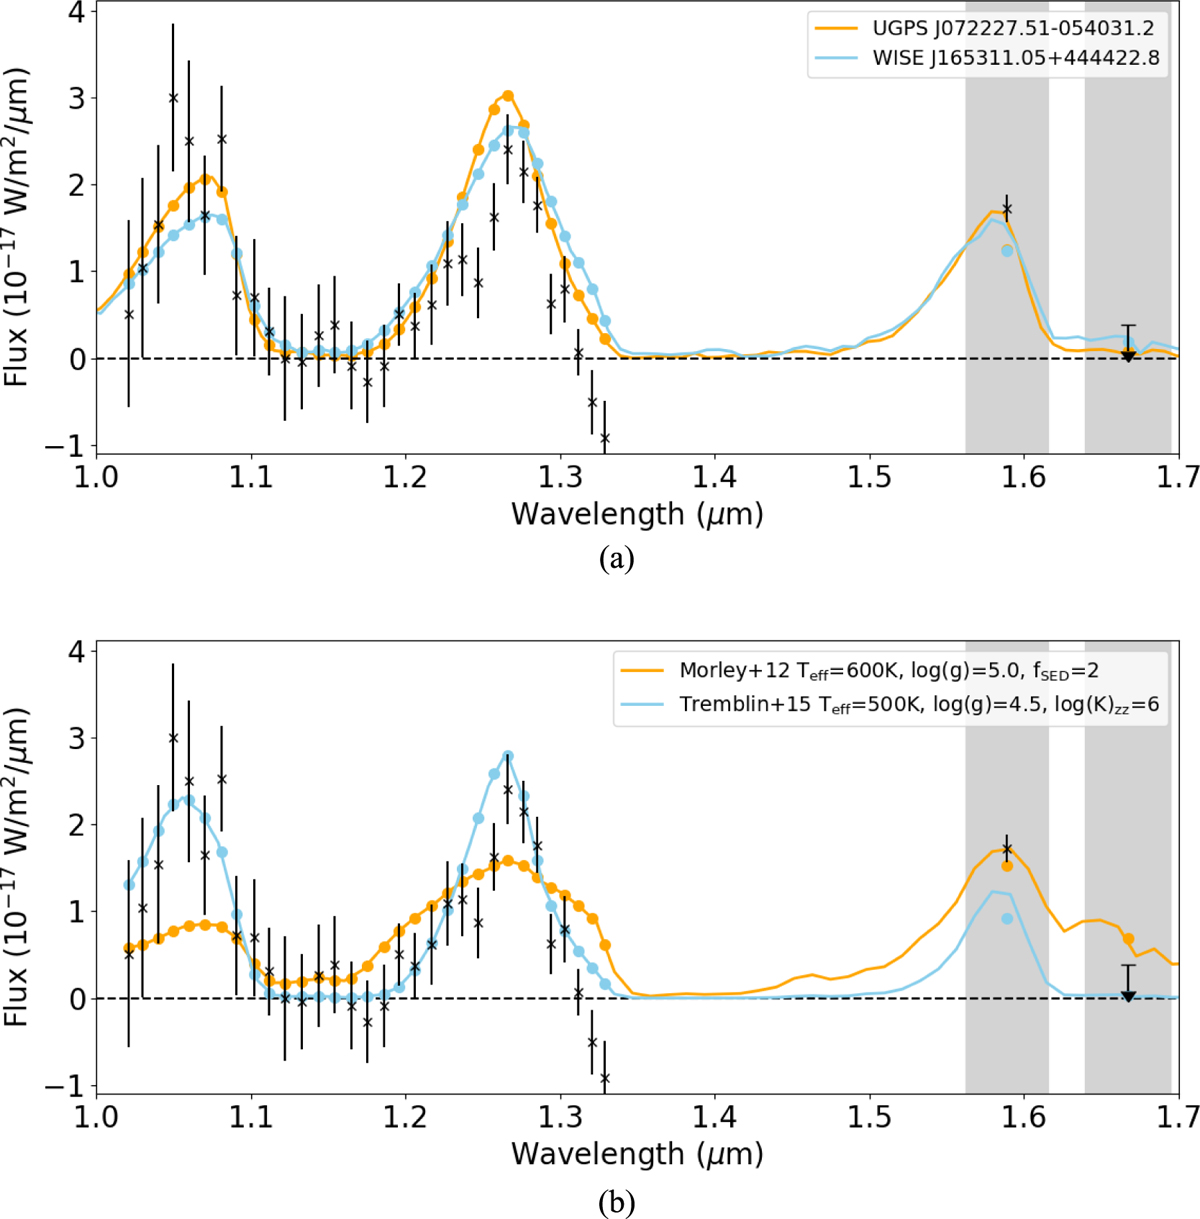
Comparison of the observed spectrum of HD 4113C with similar ultracool dwarfs and brown dwarf atmosphere models. Top panel: measured spectrum of HD 4113C extracted from the IFS and IRDIS images. Two peaks are seen in the IFS spectrum at 1.07 μm and 1.27 μm, which correspond well with the spectral features seen in late-T dwarfs. The two best-fitting spectra from the SpeX Prism library are overplotted, and the flux is scaled to match HD 4113C. The predicted flux values for each datapoint are shown with filled circles, while the datapoints are marked with crosses. The FWHM of the IRDIS filters are shown with gray bars. Fitting was performed to the IFS and IRDIS data simultaneously. Bottom panel: same as top panel, this time showing the comparison between the observed spectrum and the best-fit spectra from the Morley et al. (2012) and Tremblin et al. (2015) models, using radii of 1.4 and 1.5 RJ, respectively.
Current usage metrics show cumulative count of Article Views (full-text article views including HTML views, PDF and ePub downloads, according to the available data) and Abstracts Views on Vision4Press platform.
Data correspond to usage on the plateform after 2015. The current usage metrics is available 48-96 hours after online publication and is updated daily on week days.
Initial download of the metrics may take a while.