Fig. 2
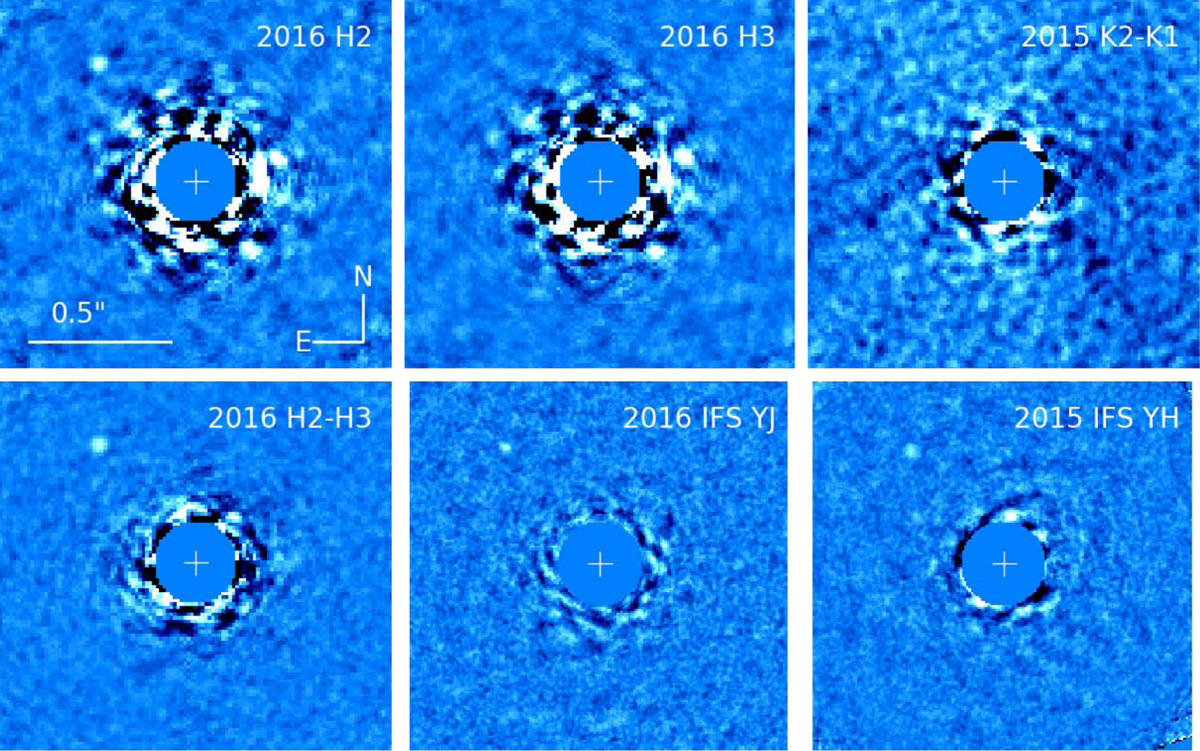
PSF-subtracted images from each dataset and epoch. For the 2016 dataset, the IRDIS H2, H3, and SDI (H2-H3) reductions are shown, while we show only the 2015 IRDIS SDI (K1-K2) reduction. We also show a weighted combination of the IFS SDI images for each epoch. Each IFS wavelength channel was weighted by the average flux predicted by the best-fitting Morley et al. (2012) and Tremblin et al. (2015) models. The strong detection of the companion in H2 and the lack of a H3 counterpart indicates the presence of strong methane absorption. All images have the same scale and orientation, and were generated by removing 20 PCA modes.
Current usage metrics show cumulative count of Article Views (full-text article views including HTML views, PDF and ePub downloads, according to the available data) and Abstracts Views on Vision4Press platform.
Data correspond to usage on the plateform after 2015. The current usage metrics is available 48-96 hours after online publication and is updated daily on week days.
Initial download of the metrics may take a while.