Fig. B.1
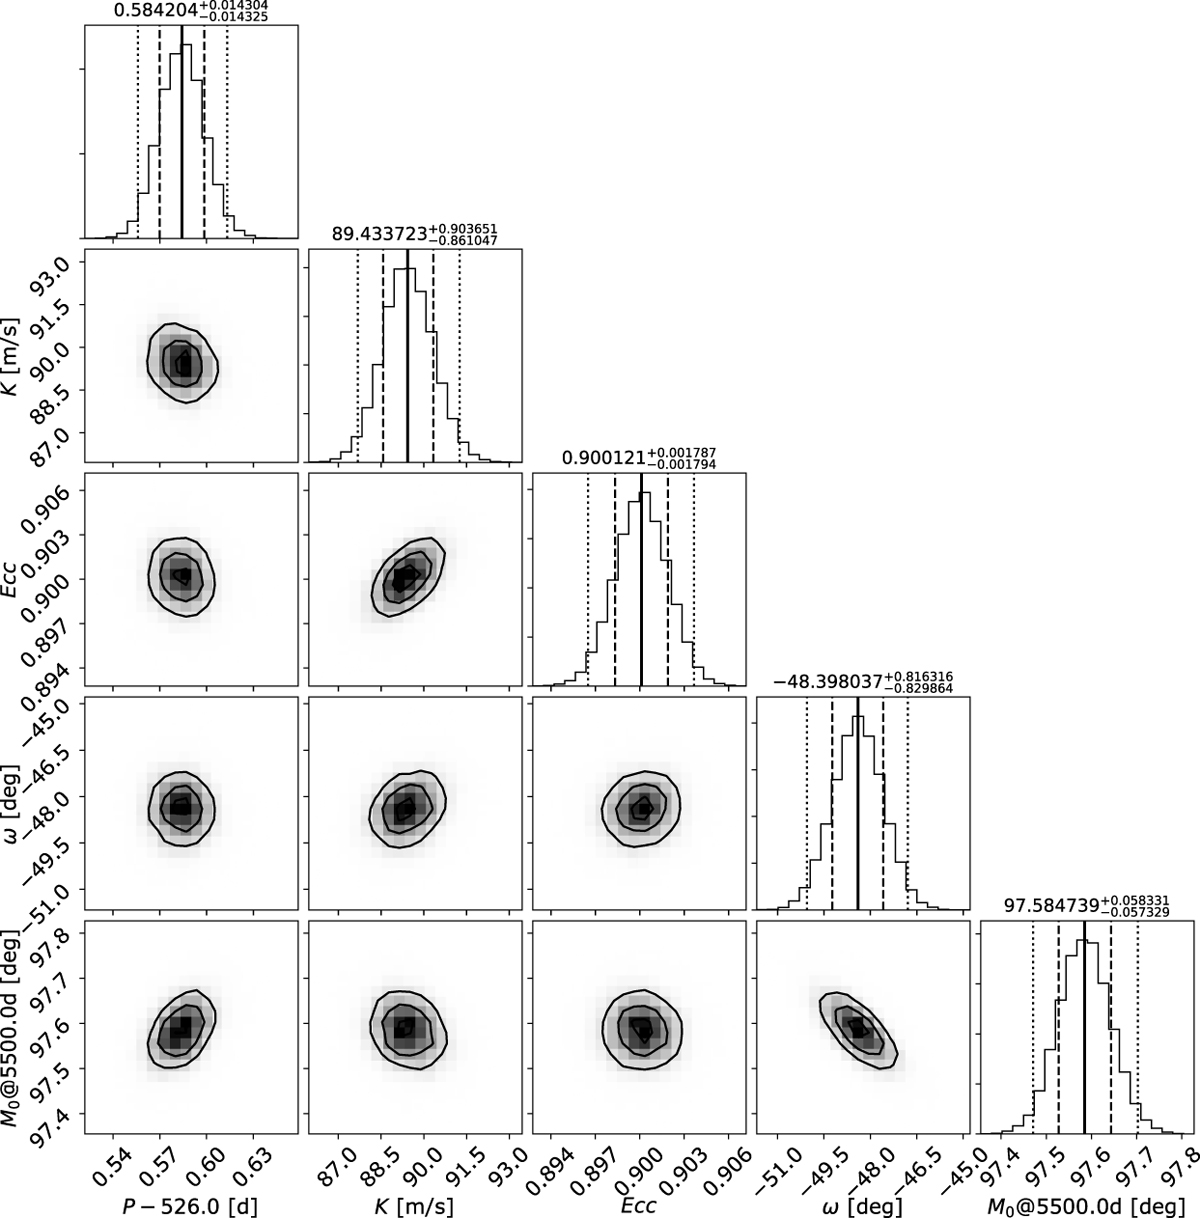
Marginalized 1D and 2D posterior distributions of the model parameters corresponding to the global fit of the RV and direct-imaging models for HD 4113 A b. Confidence intervals at 2.275%, 15.85%, 50.0%, 84.15%, and 97.725% are overplotted on the 1D posterior distribution, while the median ± 1 σ values are given at the top of each 1D posterior distributions. 1, 2, and 3 σ contour levels are overplotted on the 2D posterior distributions. The model parameters adjusted during the MCMC run are shown (P, K, e, ω, and M0).
Current usage metrics show cumulative count of Article Views (full-text article views including HTML views, PDF and ePub downloads, according to the available data) and Abstracts Views on Vision4Press platform.
Data correspond to usage on the plateform after 2015. The current usage metrics is available 48-96 hours after online publication and is updated daily on week days.
Initial download of the metrics may take a while.