| Issue |
A&A
Volume 613, May 2018
|
|
|---|---|---|
| Article Number | L9 | |
| Number of page(s) | 5 | |
| Section | Letters to the Editor | |
| DOI | https://doi.org/10.1051/0004-6361/201833232 | |
| Published online | 31 May 2018 | |
Letter to the Editor
UVIT observations of the star-forming ring in NGC 7252: Evidence of possible AGN feedback suppressing central star formation
1
Indian Institute of Astrophysics,
Koramangala II Block,
Bangalore, India
e-mail: This email address is being protected from spambots. You need JavaScript enabled to view it.
2
Department of Physics, Christ University,
Bangalore, India
3
National Research Council of Canada, Herzberg Astronomy and Astrophysics Research Centre,
Victoria, Canada
4
National Centre for Radio Astrophysics,
Pune, India
5
Tata Institute of Fundamental Research,
Mumbai, India
6
University of Calgary,
Calgary, Alberta, Canada
7
ISRO Satellite Centre,
HAL Airport Road,
Bangalore, India
8
Inter-University Center for Astronomy and Astrophysics,
Pune, India
Received:
14
April
2018
Accepted:
9
May
2018
Abstract
Context. Some post-merger galaxies are known to undergo a starburst phase that quickly depletes the gas reservoir and turns it into a red-sequence galaxy, though the details are still unclear.
Aims. Here we explore the pattern of recent star formation in the central region of the post-merger galaxy NGC 7252 using high-resolution ultraviolet (UV) images from the UVIT on ASTROSAT.
Methods. The UVIT images with 1.2 and 1.4 arcsec resolution in the FUV and NUV are used to construct a FUV-NUV colour map of the central region.
Results. The FUV-NUV pixel colour map for this canonical post-merger galaxy reveals a blue circumnuclear ring of diameter ~10′′ (3.2 kpc) with bluer patches located over the ring. Based on a comparison to single stellar population models, we show that the ring is comprised of stellar populations with ages ≲300 Myr, with embedded star-forming clumps of younger age (≲150Myr).
Conclusions. The suppressed star formation in the central region, along with the recent finding of a large amount of ionised gas, leads us to speculate that this ring may be connected to past feedback from a central super-massive black hole that has ionised the hydrogen gas in the central ~4′′ ~1.3 kpc.
Key words: galaxies: elliptical and lenticular, cD / galaxies: evolution / galaxies: formation / galaxies: nuclei / galaxies: star formation / ultraviolet: galaxies
© ESO 2018
1 Introduction
Elliptical galaxies in the local Universe are observed to be gas-poor systems with little or no detectable ongoing star formation. Since they are dominated by evolved stellar populations, they reside on the red sequence in the optical colour-magnitude relation (Visvanathan & Sandage 1977; Baldry et al. 2004). In the Λ cold dark matter paradigm, the formation of such galaxies proceeds through a hierarchical process in which a spectrum of progenitors, having different gas contents and masses, merge during the protracted assembly of the galaxy (De Lucia et al. 2006; Faber et al. 2007; Naab et al. 2009; Trujillo et al. 2011).
Generally speaking, major mergers are known to be common at high redshift while minor mergers dominate in the local Universe (Conselice et al. 2003; Kaviraj 2014). According to the major merger scenario, two gas-rich star-forming disc galaxies can merge to form an elliptical galaxy (Toomre & Toomre 1972). Initially, the merged system is gas rich, but then undergoes a starburst phase that quickly depletes the gas reservoir and truncates further star formation. In the high-redshift Universe, we observe many elliptical galaxies going through a starburst that follows a major merger. The manner in which star formation progresses in post-merger galaxies is, however, unclear; does it occur in a disc, or continue the star formation initiated from the pre-merger phase?
There are clues from observations of post-merger elliptical galaxies showing ongoing star formation; such systems often show signatures of disc components (George 2017). The post-merger galaxy NGC 7252 is a classic example of an elliptical-like galaxy forming from the merger of two disc galaxies (Schweizer 1982; Dupraz et al. 1990; Wang et al. 1992; Fritze-v. Alvensleben & Gerhard 1994; Hibbard et al. 1994). The main body (i.e. central core) of NGC 7252 has an elliptical morphology and exhibits intense star formation (Schweizer 1982; Lake & Dressler 1986; Hibbard & Mihos 1995; Genzel et al. 2001; Rothberg & Joseph 2006). The reservoir of gas acquired from the progenitor galaxies contributes to ongoing star formation in a central disc, and early optical studies based on HST observations have demonstrated the existence of a small spiral pattern near the center of the galaxy (Dupraz et al. 1990; Whitmore et al. 1993; Miller et al. 1997; Laine et al. 2003; Rossa et al. 2007; Ueda et al. 2014; also see Fig. 1 of Weaver et al. 2018). NGC 7252 is known to have a gaseous disc that is actively forming stars. The gas disc, which has a very low velocity dispersion (a condition necessary for star formation), formed within the last 100 Myr after final coalescence. It co-rotates with the stellar disc with an inward radial dependence on the ionisation state (Weaver et al. 2018).
We study the stellar disc in the main body of NGC 7252 using newly acquired ultraviolet (UV) images. The integrated spectral energy distributions (SED) of young stellar populations peak at UV wavelengths due to the presence of hot OBA stars, so the UV flux directly traces the star formation within the past 100–200 Myr (Kennicutt & Evans 2012). The near-ultraviolet (NUV) and far-ultraviolet (FUV) images presented here were acquired with the Ultraviolet Imaging Telescope (UVIT) on board ASTROSAT, and thus probe recent star formation in this benchmark galaxy over scales of ~400 pc. Throughout this paper, we adopt a flat Universe cosmology with Ho = 71 km s−1 Mpc−1, Ω M =0.27, Ω Λ = 0.73 (Komatsu et al. 2011).
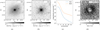 |
Fig. 1 Astrometry-corrected NUV, FUV images (a and b), azimuthally averaged FUV, NUV profile (in concentric annuli of width 1′′) (c) and the NUV/FUV image of NGC 7252 (d). The scaling of flux units is shown in the colour bar. |
2 Observations and analysis
NGC 72521 with a spectroscopic redshift z ~ 0.0159 is located at a luminosity distance2 ~ 68 Mpc (Rothberg & Joseph 2006). The angular scale of 1” corresponds to 0.32 kpc at the distance of the galaxy. NGC 7252 was observed at FUV (F148W filter, λmean = 148.1 nm, δλ = 78.5 nm) and NUV (N242W filter, λmean = 241.8 nm, δλ = 50 nm) wavelengths using the UVIT instrument on board the Indian multi-wavelength astronomy satellite ASTROSAT (Agrawal 2006). The UVIT imaging yields a resolution of ~ 1.2′′ for the NUV and ~ 1.4′′ for the FUV channels. Details on the UVIT observations of the star-forming tidal tail and main body of the galaxy are given in George et al. (2018). The astrometric calibration for the NUV and FUV images are performed using the astrometry.net package where solutions are performed using the USNO-B catalogue (Lang et al. 2010). The foreground extinction from the Milky Way galaxy in the direction of NGC 7252 is AV = 0.10 (Schlegel et al. 1998) which we scaled to the FUV and NUV λmean values using the Cardelli et al. (1989) extinction law and corrected the magnitudes. The astrometry-corrected NUV, FUV images, azimuthally averaged FUV, NUV profile, and the ratio image of NGC 7252 in flux units are shown in Fig. 1. The NUV, FUVradial profiles in units of magnitude/arcsec2 are created from concentric annuli of width 1′′, up to a distance of ~ 13′′ from the centre of the galaxy (AB magnitude system). The NUV, FUV profiles and the ratio image show higher values for NUV/FUV flux at the centre of NGC 7252. This implies a decrease in FUV flux towards the central region of NGC 7252. We investigate this further in the following by creating a FUV-NUV colour map of the central region of NGC 7252.
The NUV and FUV images of NGC 7252 are first aligned in astrometry and then Gaussian-smoothed using a kernel of 1.4′′ in width to suppress noise and also to make the images match in resolution. The region of the FUV and NUV images that correspond to the main body of NGC 7252 was isolated using the background counts from the whole image to set the threshold. Pixels with values above the 3σ of the threshold were selected to isolate the region of interest. The counts in the selected pixels were background subtracted, integration time weighted, and converted to magnitude units using the zeropoints of Tandon et al. (2017, see their Table 4). Magnitudes for each pixel are used to compute the FUV–NUV colour map of the galaxy (see Fig. 2). The pixels are colour coded in units of FUV–NUV colour. The image is of size ~ 50′′ × 50′′ and corresponds to a physical sizeof ~16 kpc on each side at the rest-frame of the galaxy. The corresponding azimuthally averaged FUV–NUV profile of the central region of the galaxy, which is shown in Fig. 3, clearly shows a red core and surroundingblue ring. The FUV–NUV colour map of the main body of NGC 7252 displays a red region at the centre and outskirts of the galaxy and there exists a blue ring around the centre with localised bluer patches.
We investigated if the ring is an artifact due to a mismatch in astrometry between the NUV and FUV images of NGC 7252. We measured the WCS centroid positions of five field stars from the NUV and FUV images of the 28′ UVIT field of view. The centroid offset between the images is found to be less than a pixel. We also created a pixel colour map of the five fieldstars which shows a smooth profile without any ring pattern. We therefore confirm that the ring in the centre region of NGC 7252 is indeed significant.
The FUV–NUV colour map of NGC 7252 main body reveals a circumnuclear ring that is significantly bluer than the central regions of the galaxy (i.e. FUV–NUV per pixel ≲ 0.5 mag). The ring is ~ 3.2 kpc (10 arcsec) in diameter and contains bluer spots located on opposite sides. The central redder region is of size 1.3 kpc (4 arcsec), which is significantly redder in FUV–NUV colour as shown in Fig. 2. The FUV–NUV colour map of NGC 7252 can be used to understand central star formation in this galaxy and can, in particular, offer insights into the last starburst. We used the Starburst99 stellar synthesis code to characterise the age of the underlying stellar population corresponding to the FUV–NUV ring (Leitherer et al. 1999). We selected 19 single stellar population (SSP) models over an age range of 1 to 900 Myr assuming a Kroupa IMF (Kroupa 2001) and solar metallicity (Z = 0.02). The synthetic SED for a given age was then convolved with the effective area of the FUV and NUV passbands to compute the expected fluxes. The estimated values were then used to calculate the SSP ages corresponding to the observed FUV–NUV colours. We performed a linear interpolation for the observed colour value and estimated the corresponding ages in all pixels in the FUV–NUV colour map. The age contours corresponding to 150, 250, 300 Myr were generated and overlaid on the colour map to isolate the regions of constant age, as shown in Fig. 2. This exercise shows that the circumnuclear ring hosts stellar populations of age ≲300 Myr, within which are embedded bluer, younger patches of star formation (≲50–250 Myr).
Figure 3 shows an azimuthally averaged colour profile in the central 12” of NGC 7252. The FUV–NUV colour has been measured in concentric annuli of width 1′′ (320 pc). We note the striking change in the colour profile moving outwards, where the colour falls from red values in the core, to blue values in the ring, and finally to progressively redder colours with increasing distance from the galaxy centre.
The FUV and NUV flux is subjected to extinction at the rest-frame of the galaxy. We do not have a proper extinction map of the galaxy NGC 7252. The FUV–NUV pixel colour maps and the derived ages can therefore be considered as the upper limits of the actual values. We note that Weaver et al. (2018, see Fig. 7a) discusses the extinction in the main body of the galaxy.
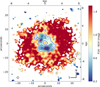 |
Fig. 2 FUV–NUV colour map of the main body of NGC 7252. The pixels are colour-coded in units of FUV–NUV colour. The point spread function for UVIT is shown in black circle. The image measures ~ 50′′ × 50′′ and corresponds to a physical size of ~16 kpc on each side. Age contours of 150 (red), 250 (green), 300 (blue) Myr are overlaid over the colour map to isolate regions of constant age. The blue ring is clearly seen with bluer colour clumps. The ring hosts young (≲ 150 Myr) stellar populations compared to the rest of the galaxy. |
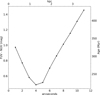 |
Fig. 3 Azimuthally averaged FUV–NUV colour profile of NGC 7252. The 12′′ (3.8 kpc) region at the centre of the galaxy been averaged in colour in concentric annuli of width 1′′. The profile shows negative gradient (i.e. an outward change from red to blue colours) out to ~ 4′′, and then a steady reddening of the galaxy from 4′′ to 12′′. The FUV–NUV colour values and the corresponding age estimates are shown on the left and right axes, respectively. |
3 Discussion
The main body of NGC 7252 is covered in the ~40′′ region of the FUV–NUV colour map shown in Fig. 2. The blue colour ring seen in FUV–NUV colour map is of size ~10′′, similar to the one detected in previous studies. In the following, we call the blue patches seen on the ring as star-forming clumps. The ring can be caused either by high extinction or by inhibited star formation in the core (i.e., central 4′′ of the galaxy). Because dust attenuates more flux in the FUV than in the NUV, FUV–NUV colours will be redder due to extinction. The AV map (in AB magnitude) created from H γ/Hβ emission line ratio of the central ~12′′ region, based on observations with IFU on VIMOS/VLT, is shown in Fig. 7a of Weaver et al. (2018). The figure shows that the extinction at the core is small compared to the rest of the main body of the galaxy. We note, however, that the extinction is more than 2 mag in the eastern region between the young (<150 Myr) star forming clumps. It is therefore possible that the higher age (<250 Myr) of the star-forming region between the young star-forming clumps could be due to the extinction. The star forming clumps can therefore be considered as the endpoints of star formation along an arc-like structure. Figure 7b of Weaver et al. (2018) demonstrates clearly that there is a lack of ongoing star formation in the core and Fig. 7a of ofthe same paper shows that the extinction is negligible in the core. Taken together this rules out the possibility that the ring is caused by central extinction; rather, the central region seems devoid of recent star formation.
We independently confirm here the existence of a star forming ring with age ≲ 300 Myr, hosting clumps of younger star forming regions of age <150 Myr based on the UV imaging observations. We also note that previous studies have demonstrated the existence of ionised and molecular gas rings (Schweizer 1982; Wang et al. 1992). The previous observations on NGC 7252 based on radio to X-ray wavelengths had so far not conclusively confirmed the presence of an AGN at the centre. There exists [OIII] nebular emission 5 kpc south-west of the galaxy based on which Schweizer et al. (2013) argue for the existence of a faint ionization echo excited by a mildly active nucleus that has declined by approximately three orders of magnitude over the past 20 000–200 000 yr. The stellar and gaseous kinematics of the central 50′′ × 50′′ region of NGC 7252 has recently been reported using the IFU on VIMOS/VLT (Weaver et al. 2018). The study reports a central kiloparsec-scale gas disc which has re-formed within the past 100 Myr since the formation of the central region of the galaxy. The present study confirms the presence of such a disc in the UV, but with the shape of a ring. The star-forming ring is hosting multiple stellar populations of ages <150 Myr and <300 Myr, (even after taking into account the UV extinction between the young star-forming clumps). This means that there were conditions responsible for triggering in-situ star formation at two epochs separated by ~150 Myr. Also the ages of the star-forming regions are compatible with the time required for the availability of cold gas in a settled disc near to the galaxy centre after a major-merger (Weaver et al. 2018). It is also interesting to note that the [OIII] emission line flux map of NGC 7252 shows an enhancement in flux level at the central 2′′ region compared to the outskirts (Weaver et al. 2018). The emission line flux maps cover the central 12′′ of the galaxy which incidentally covers the FUV–NUV blue colour ring we detect in NGC 7252. The ionisation gas excitation is high inwards of 2′′ to the centre of the galaxy and is proposed to be due to shocks and AGN ionisation decreasing with distance from the centre. This could be due to gas ioinisation from a low-luminosity AGN at the centre. Also, the drop in H β emission at the centre of the galaxy confirms that the centre is devoid of star formation.
The radio spectral index measured from the flux at 147 MHz and 1.4 GHz by TIFR GMRT Sky Survey (TGSS) and the NRAO VLA Sky Survey (NVSS) at the location of NGC 7252 is found to be ~–0.66, typical of emission from AGN dominated by the extended lobes (de Gasperin et al. 2018). We note that the average peak-to-total TGSS flux ratio (0.80), the logarithm of TGSS flux density (–0.93 Jy), and the spectral index values from the direction of NGC 7252 point towards the presence of AGN (de Gasperin et al. 2018, see Fig. 12). We also note that previous X-ray observationsderived a photon index of 1.72 in the 0.5–10.0 keV from the nuclear region of NGC 7252 (Nolan et al. 2004). The derived X-ray photon index seems to suggest that the source is typical of a Seyfert-type AGN (Nandra & Pounds 1994; Ishibashi & Courvoisier 2010). This can be considered as independent evidence coming from radio and X-ray wavebands about the nature of the source at the centre of NGC 7252.
The role of accreting black holes in suppressing star formation (quenching) and thereby regulating the galaxy evolution is studied extensively in recent literature using simulations and is also supported by observations (Sanders et al. 1988; Springel et al. 2005; Di Matteo et al. 2005; Schawinski et al. 2007; Somerville et al. 2008; Hopkins et al. 2008; Schawinski et al. 2010; Cheung et al. 2016). The starforming ring in NGC 7252 is therefore interesting and could be carrying the imprint of star formation quenching in a post merger galaxy. The influence of a jet launched from an accreting black hole on the galaxy-scale star formation is demonstrated in recent simulations (Ishibashi & Fabian 2012; Gaibler et al. 2012; Ishibashi & Fabian 2014). The blast wave from the jet (launched horizontally) can create a bow shock in the vertical direction, pushing the gas outwards creating a cavity at the centre. If the gas density reaches the critical density, triggered star formation can then proceed in a ring similar to the pattern we see in NGC 7252 (Gaibler et al. 2012, see Fig. 5). We emphasise here that the ring-like star formation seen from the FUV–NUV colour map of NGC 7252 can be reproduced in simulation where an accreting black hole can inhibit central star formation.
The FUV–NUV colour map reveals that star formation is not uniform along the ring, which is expected from a single burst of star formation. There exists young clumpy star-forming regions with presumably strong dust-obscuration in between, which can be differentiated into a star-forming arc with respect to the relatively older ring. This age-distinction can represent two epochs with conditions responsible for star formation. We propose two scenarios here; Star formation happening at two separate epochs due to the availability of cold gas following the merger at two separate periods. The episodic activity of the central ionizing source inhibiting star formation (on the star-formingring) for a brief period. If true, similar episodic star-formation activity can be expected which will delay the rapid depletion of the gas reservoir in NGC 7252. This will further delay the (already higher) quenching time scale proposed for NGC 7252 (Weaver et al. 2018)and slow down the migration of NGC 7252 from the blue cloud to the red sequence on the galaxy colour-magnitude diagram.
The distribution of HI gas in NGC 7252, based on VLA 21cm observations, has demonstrated that the neutral hydrogen gas is distributed more along the tidal tails compared to the centre of the galaxy (Hibbard et al. 1994; Lelli et al. 2015; see Fig. 3 of Lelli et al. (2015) for HI contours overlaid on the R−band image of NGC 7252). The gas at the centre might have been acquired in the merger, settling in the form of a disc that hosts star formation and perhaps feeds a possible central black hole. The blue circumnuclear ring seen in the FUV–NUV colour map may then be the signature of the last burst of star formation fed by gas left over from the merger. The main body of this post-merger galaxy shows properties typical of elliptical galaxies, but resides in the blue cloud of the galaxy colour-magnitude diagram (Weaver et al. 2018). We note that if NGC 7252 were at higher redshifts, the tidal tails would be very faint and therefore difficult to detect in imaging data and the galaxy would be classified as a star-forming, blue early-type galaxy (Schawinski et al. 2009; George 2017). In this scenario, it is expected that NGC 7252 will evolve onto the red sequence once the ongoing star formation is quenched.
4 Conclusions
The post-merger galaxy NGC 7252 has been observed with the UVIT instrument on ASTROSAT. FUV and NUV images with a spatial resolution of 1.2′′ –1.4′′ have been used to construct the first FUV–NUV colour map of the galaxy. We detect a blue, circumnuclear ring of diameter ~10′′ (3.2 kpc). The central 4′′ (1.3 kpc) region of the galaxy has a red FUV–NUV colour compared to the blue ring. We used single stellar population models, converting the FUV–NUV pixel colour map into an age map, to demonstrate that this star-forming ring hosts stellar populations with ages ≲300 Myr, with bluer clumps of younger star-forming regions (≲150 and 250 Myr) distributed over the ring. Results from previous studies suggest the existence of an ionising source at the centre of the galaxy, likely an accreting black hole that was active in the past. The presence of such a source in the centre of this post-merger galaxy would have negative feedback on surrounding star formation (which requires dynamically cold molecular hydrogen). Star formation in the core would therefore be inhibited, while triggered star formation proceeds in a surrounding ring.
Acknowledgements
We thank the referee for his/her comments, which improved the scientific content of the paper. This publication uses the data from the AstroSat mission of the Indian Space Research Organisation (ISRO), archived at the Indian Space Science Data Centre (ISSDC). This research made use of Astropy, a community-developed core Python package for Astronomy (Astropy Collaboration et al. 2018).
References
- Agrawal, P. C. 2006, Adv. Space Res., 38, 2989 [NASA ADS] [CrossRef] [Google Scholar]
- Astropy Collaboration, Price-Whelan, A. M., Sipőcz, B. M., et al. 2018, [arXiv:1801.02634] [Google Scholar]
- Baldry, I. K., Glazebrook, K., Brinkmann, J., et al. 2004, ApJ, 600, 681 [NASA ADS] [CrossRef] [Google Scholar]
- Cardelli, J. A., Clayton, G. C., & Mathis, J. S. 1989, ApJ, 345, 245 [NASA ADS] [CrossRef] [Google Scholar]
- Cheung, E., Bundy, K., Cappellari, M., et al. 2016, Nature, 533, 504 [NASA ADS] [CrossRef] [Google Scholar]
- Conselice, C. J., Bershady, M. A., Dickinson, M., & Papovich, C. 2003, AJ, 126, 1183 [NASA ADS] [CrossRef] [Google Scholar]
- de Gasperin, F., Intema, H. T., & Frail, D. A. 2018, MNRAS, 474, 5008 [NASA ADS] [CrossRef] [Google Scholar]
- De Lucia, G., Springel, V., White, S. D. M., Croton, D., & Kauffmann, G. 2006, MNRAS, 366, 499 [NASA ADS] [CrossRef] [Google Scholar]
- Di Matteo, T., Springel, V., & Hernquist, L. 2005, Nature, 433, 604 [NASA ADS] [CrossRef] [PubMed] [Google Scholar]
- Dupraz, C., Casoli, F., Combes, F., & Kazes, I. 1990, A&A, 228, L5 [NASA ADS] [Google Scholar]
- Faber, S. M., Willmer, C. N. A., Wolf, C., et al. 2007, ApJ, 665, 265 [NASA ADS] [CrossRef] [Google Scholar]
- Fritze-v. Alvensleben, U., & Gerhard, O. E. 1994, A&A, 285, 751 [NASA ADS] [Google Scholar]
- Gaibler, V., Khochfar, S., Krause, M., & Silk, J. 2012, MNRAS, 425, 438 [NASA ADS] [CrossRef] [Google Scholar]
- Genzel, R., Tacconi, L. J., Rigopoulou, D., Lutz, D., & Tecza, M. 2001, ApJ, 563, 527 [NASA ADS] [CrossRef] [Google Scholar]
- George, K. 2017, A&A, 598, A45 [NASA ADS] [CrossRef] [EDP Sciences] [Google Scholar]
- George, K., Joseph, P., Côté, P., et al. 2018, A&A, in press, DOI:10.1051/0004-6361/201832705 [Google Scholar]
- Hopkins, P. F., Hernquist, L., Cox, T. J., & Kereš D. 2008, ApJS, 175, 356 [NASA ADS] [CrossRef] [Google Scholar]
- Hibbard, J. E., Guhathakurta, P., van Gorkom, J. H., & Schweizer, F. 1994, AJ, 107, 67 [NASA ADS] [CrossRef] [Google Scholar]
- Hibbard, J. E., & Mihos, J. C. 1995, AJ, 110, 140 [NASA ADS] [CrossRef] [Google Scholar]
- Ishibashi, W., & Courvoisier, T. J.-L. 2010, A&A, 512, A58 [NASA ADS] [CrossRef] [EDP Sciences] [Google Scholar]
- Ishibashi, W., & Fabian, A. C. 2012, MNRAS, 427, 2998 [NASA ADS] [CrossRef] [Google Scholar]
- Ishibashi, W., & Fabian, A. C. 2014, MNRAS, 441, 1474 [NASA ADS] [CrossRef] [Google Scholar]
- Kaviraj, S. 2014, MNRAS, 437, L41 [NASA ADS] [CrossRef] [Google Scholar]
- Kennicutt, R. C., & Evans, N. J. 2012, ARA&A, 50, 531 [NASA ADS] [CrossRef] [Google Scholar]
- Komatsu E., Smith K. M., Dunkley J., et al. 2011, ApJS, 192, 18 [NASA ADS] [CrossRef] [Google Scholar]
- Kroupa, P. 2001, MNRAS, 322, 231 [NASA ADS] [CrossRef] [Google Scholar]
- Lake, G., & Dressler, A. 1986, ApJ, 310, 605 [NASA ADS] [CrossRef] [Google Scholar]
- Laine, S., van der Marel, R. P., Rossa, J., et al. 2003, AJ, 126, 2717 [NASA ADS] [CrossRef] [Google Scholar]
- Lang, D., Hogg, D. W., Mierle, K., Blanton, M., & Roweis, S. 2010, AJ, 139, 1782 [Google Scholar]
- Leitherer, C., Schaerer, D., Goldader, J. D., et al. 1999, ApJS, 123, 3 [NASA ADS] [CrossRef] [Google Scholar]
- Lelli, F., Duc, P.-A., Brinks, E., et al. 2015, A&A, 584, A113 [NASA ADS] [CrossRef] [EDP Sciences] [Google Scholar]
- Miller, B. W., Whitmore, B. C., Schweizer, F., & Fall, S. M. 1997, AJ, 114, 2381 [NASA ADS] [CrossRef] [Google Scholar]
- Naab, T., Johansson, P. H., & Ostriker, J. P. 2009, ApJ, 699, L178 [NASA ADS] [CrossRef] [Google Scholar]
- Nandra, K., & Pounds, K. A. 1994, MNRAS, 268, 405 [NASA ADS] [CrossRef] [Google Scholar]
- Nolan, L. A., Ponman, T. J., Read, A. M., & Schweizer, F. 2004, MNRAS, 353, 221 [NASA ADS] [CrossRef] [Google Scholar]
- Postma, J. E., & Leahy, D. 2017, PASP, 129, 115002 [NASA ADS] [CrossRef] [Google Scholar]
- Rossa, J., Laine, S., van der Marel, R. P., et al. 2007, AJ, 134, 2124 [NASA ADS] [CrossRef] [Google Scholar]
- Rothberg, B., & Joseph, R. D. 2006, AJ, 131, 185 [NASA ADS] [CrossRef] [Google Scholar]
- Sanders, D. B., Soifer, B. T., Elias, J. H., Neugebauer, G., & Matthews, K. 1988, ApJ, 328, L35 [NASA ADS] [CrossRef] [Google Scholar]
- Schawinski, K., Thomas, D., Sarzi, M., et al. 2007, MNRAS, 382, 1415 [NASA ADS] [CrossRef] [Google Scholar]
- Schawinski, K., Lintott, C., Thomas, D., et al. 2009, MNRAS, 396, 818 [NASA ADS] [CrossRef] [Google Scholar]
- Schawinski, K., Dowlin, N., Thomas, D., Urry, C. M., & Edmondson, E. 2010, ApJ, 714, L108 [NASA ADS] [CrossRef] [Google Scholar]
- Schlegel, D. J., Finkbeiner, D. P., & Davis, M. 1998, ApJ, 500, 525 [NASA ADS] [CrossRef] [Google Scholar]
- Schweizer, F. 1982, ApJ, 252, 455 [NASA ADS] [CrossRef] [Google Scholar]
- Schweizer, F., Seitzer, P., Kelson, D. D., Villanueva, E. V., & Walth, G. L. 2013, ApJ, 773, 148 [NASA ADS] [CrossRef] [Google Scholar]
- Somerville, R. S., Hopkins, P. F., Cox, T. J., Robertson, B. E., & Hernquist, L. 2008, MNRAS, 391, 481 [NASA ADS] [CrossRef] [Google Scholar]
- Springel, V., Di Matteo, T., & Hernquist, L. 2005, ApJ, 620, L79 [NASA ADS] [CrossRef] [Google Scholar]
- Subramaniam, A., Tandon, S. N., Hutchings, J., et al. 2016, Proc. SPIE, 9905, 99051F [Google Scholar]
- Tandon, S. N., Subramaniam, A., Girish, V., et al. 2017, AJ, 154, 128 [NASA ADS] [CrossRef] [Google Scholar]
- Toomre, A. 1977, Evolution of Galaxies and Stellar Populations, 401 [Google Scholar]
- Toomre, A., & Toomre, J. 1972, ApJ, 178, 623 [NASA ADS] [CrossRef] [Google Scholar]
- Trujillo, I., Ferreras, I., & de La Rosa, I. G. 2011, MNRAS, 415, 3903 [NASA ADS] [CrossRef] [Google Scholar]
- Ueda, J., Iono, D., Yun, M. S., et al. 2014, ApJS, 214, 1 [NASA ADS] [CrossRef] [Google Scholar]
- Visvanathan, N., & Sandage, A. 1977, ApJ, 216, 214 [NASA ADS] [CrossRef] [Google Scholar]
- Wang, Z., Schweizer, F., & Scoville, N. Z. 1992, ApJ, 396, 510 [NASA ADS] [CrossRef] [Google Scholar]
- Weaver, J. R., Husemann, B., Kuntschner, H., et al. 2018, A&A, in press, DOI: 10.1051/0004-6361/201732448 [Google Scholar]
- Whitmore, B. C., Schweizer, F., Leitherer, C., Borne, K., & Robert, C. 1993, AJ, 106, 1354 [Google Scholar]
α(J2000) = 22:20:44.7 and δ(J2000) = 24:40:42 according to NED.
All Figures
|
Fig. 1 Astrometry-corrected NUV, FUV images (a and b), azimuthally averaged FUV, NUV profile (in concentric annuli of width 1′′) (c) and the NUV/FUV image of NGC 7252 (d). The scaling of flux units is shown in the colour bar. |
| In the text | |
|
Fig. 2 FUV–NUV colour map of the main body of NGC 7252. The pixels are colour-coded in units of FUV–NUV colour. The point spread function for UVIT is shown in black circle. The image measures ~ 50′′ × 50′′ and corresponds to a physical size of ~16 kpc on each side. Age contours of 150 (red), 250 (green), 300 (blue) Myr are overlaid over the colour map to isolate regions of constant age. The blue ring is clearly seen with bluer colour clumps. The ring hosts young (≲ 150 Myr) stellar populations compared to the rest of the galaxy. |
| In the text | |
|
Fig. 3 Azimuthally averaged FUV–NUV colour profile of NGC 7252. The 12′′ (3.8 kpc) region at the centre of the galaxy been averaged in colour in concentric annuli of width 1′′. The profile shows negative gradient (i.e. an outward change from red to blue colours) out to ~ 4′′, and then a steady reddening of the galaxy from 4′′ to 12′′. The FUV–NUV colour values and the corresponding age estimates are shown on the left and right axes, respectively. |
| In the text | |
Current usage metrics show cumulative count of Article Views (full-text article views including HTML views, PDF and ePub downloads, according to the available data) and Abstracts Views on Vision4Press platform.
Data correspond to usage on the plateform after 2015. The current usage metrics is available 48-96 hours after online publication and is updated daily on week days.
Initial download of the metrics may take a while.