| Issue |
A&A
Volume 612, April 2018
|
|
|---|---|---|
| Article Number | A61 | |
| Number of page(s) | 18 | |
| Section | Stellar structure and evolution | |
| DOI | https://doi.org/10.1051/0004-6361/201732363 | |
| Published online | 25 April 2018 | |
Supernovae from massive stars with extended tenuous envelopes
1
Unidad Mixta Internacional Franco-Chilena de Astronomía (CNRS UMI 3386),
Departamento de Astronomía, Universidad de Chile, Camino El Observatorio 1515,
Las Condes,
Santiago, Chile
e-mail: This email address is being protected from spambots. You need JavaScript enabled to view it.
2
Department of Physics and Astronomy, Seoul National University,
Gwanak-ro 1,
Gwanak-gu,
Seoul
151-742, Republic of Korea
3
Racah Institute of Physics, The Hebrew University,
Jerusalem
91904, Israel
Received:
26
November
2017
Accepted:
25
December
2017
Abstract
Massive stars with a core-halo structure are interesting objects for stellar physics and hydrodynamics. Using simulations for stellar evolution, radiation hydrodynamics, and radiative transfer, we study the explosion of stars with an extended and tenuous envelope (i.e. stars in which 95% of the mass is contained within 10% or less of the surface radius). We consider both H-rich supergiant and He-giant progenitors resulting from close-binary evolution and dying with a final mass of 2.8–5 M⊙. An extended envelope causes the supernova (SN) shock to brake and a reverse shock to form, sweeping core material into a dense shell. The shock-deposited energy, which suffers little degradation from expansion, is trapped in ejecta layers of moderate optical depth, thereby enhancing the SN luminosity at early times. With the delayed 56Ni heating, we find that the resulting optical and near-IR light curves all exhibit a double-peak morphology. We show how an extended progenitor can explain the blue and featureless optical spectra of some Type IIb and Ib SNe. The dense shell formed by the reverse shock leads to line profiles with a smaller and near-constant width. This ejecta property can explain the statistically narrower profiles of Type IIb compared to Type Ib SNe, as well as the peculiar Hα profile seen in SN 1993J. At early times, our He-giant star explosion model shows a high luminosity, a blue colour, and featureless spectra reminiscent of the Type Ib SN 2008D, suggesting a low-mass progenitor.
Key words: radiative transfer / hydrodynamics / supernovae: general
© ESO 2018
1 Introduction
The light curves of Type IIb and Ib supernovae (SNe) are understood to stem from the decay of 56Ni, exhibiting a bolometric maximum about 20–30 d after the time of explosion (Ensman & Woosley 1988; Richardson et al. 2006; Drout et al. 2011; Bianco et al. 2014; Taddia et al. 2015). Some SNe that exhibit a comparable brightness at maximum (compatible with a few 0.01 M⊙ of 56Ni) have, in contrast, vastly different light curves prior to maximum (Fig. 1). For example, the Type IIb SN 1993J is about 3 mag brighter than its counterpart SN 2008ax about 20 d before maximum. This feature is not limited to H-rich progenitors since similar offsets are also seen amongst Type Ib SNe (e.g. SNe 2008D and 1999ex; Fig. 1)1.
Various mechanisms and/or progenitor/ejecta properties may produce this luminosity boost at early times, including
- 1)
an increase in progenitor radius up to a few 100 R⊙ (e.g. Nomoto et al. 1993; Podsiadlowski et al. 1993; Woosley et al. 1994);
- 2)
an enhanced mixing of 56Ni into the outer ejecta, as originally inferred for SN 1987A (e.g. Arnett et al. 1989);
- 3)
an interaction with a companion star in close-binary systems (Kasen 2010; Moriya et al. 2015a); and
- 4)
an interaction with circumstellar material (CSM), in analogy with SNe IIn (Schlegel 1990).
In addition to an impact on the SN luminosity, the ejecta dynamics and shock propagation in such progenitor stars are different, likely leading to differences in photometric (e.g. colour), spectroscopic, and polarisation signatures. For example, interaction with CSM may influence line profile formation by producing narrow H I and He I lines with extended wings through multiple electron-scattering (Chugai 2001; Groh 2014; Gräfener & Vink 2016; Dessart et al. 2016a).
The identification of a few supergiant star progenitors, and sometimes of a companion star, on pre-/post-explosion images (e.g. Aldering et al. 1994; Van Dyk et al. 2002; Maund et al. 2004, 2011;Van Dyk et al. 2013; Folatelli et al. 2014) supports the notion that, at least in some cases, the diversity in early-time light curves may reflect a variation in progenitor radii, perhaps in connection with binarity.
The supergiant progenitors of Type IIb/Ib SNe have, however, a different density structure from the blue-supergiant (BSG) and red-surpergiant (RSG) progenitors at the origin of Type II-peculiar SNe (like SN 1987A) or Type II-Plateau SNe (like SN 1999em). Indeed, SNe IIb/Ib have different light curves. They rise to the 56Ni-powered maximum much faster than SN II-peculiar objects and their post-explosion brightness is not sustained for as long as SNe II-Plateau. The SN IIb/Ib progenitors may be supergiant stars, but their mass at core collapse is much smaller than those of Type II-peculiar/II-Plateau SNe, and probably in the range 2–5 M⊙ (see e.g. Ensman& Woosley 1988).
Models of massive stars suggest that large radii are possible. This may happen in single stars because of their proximity to the Eddington limit. Because of the iron opacity bump, massive stars may expand and lower the envelope opacity, leading to the formation of a tenuous envelope above a dense core (Ishii et al. 1999; Petrovic et al. 2006; Gräfener et al. 2012). Tenuous envelopes can also result from binary star evolution. The envelopes of H-rich supergiants can be drained during mass transfer while retaining a large radius (Podsiadlowski et al. 1992). Low-mass massive stars in binary systems may also lead to the formation of He-giant stars, i.e. H-deficient stars with radii of ~100 R⊙, which eventually produce a Type Ib SN (Yoon et al. 2012; Eldridge et al. 2015; McClelland & Eldridge 2016; Yoon et al. 2017). The spatial extent of these tenuous envelopes also depends on metallicity (the abundance of metals influences the gas opacity and impacts the energy transport between the core and the stellar surface).
Radiation-hydrodynamic modelling of SNe originating from extended progenitor stars has been done, originally in the context of SN 1993J (Woosley et al. 1994; Blinnikov et al. 1998) and more recently for SN 2011dh (Bersten et al. 2012; Nakar & Piro 2014) and SN 2008D (Bersten et al. 2013), including shock breakout (Moriya et al. 2015b). They have emphasised the impact of the progenitor radius and the envelope structure on the early light curve. Here we extend these previous studies to model the bolometric and multi-band light curves as well as the spectroscopic properties of explosions arising fromH-rich and H-deficient stars with an extended envelope. We also devote more time to discussing the importance of the envelope structure on the shock dynamics, something that may have relevance in all types of SNe.
This paper is structured as follows. In Sect. 2, we briefly review the set of observations that we use to confront our model results. In Sect. 3, we review the numerical approach used to model the pre-SN evolution, the explosion, and the subsequent ejecta/radiation until around the time of bolometric maximum. In Sect. 4, we discuss the dynamics of the shock until shock breakout as well as the ejecta evolution until the dynamics is over (i.e. when homologous expansion is established). In Sect. 5, we describe the photometric and spectroscopic properties of the emergent radiation for our model set, which includes both H-rich and H-deficient progenitors. In Sect. 6, we confront our results to the observations of a few SNe. In Sect. 7, we present our conclusions.
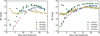 |
Fig. 1 Evolution of the U-and V -band absolute magnitudes for two SNe IIb (1993J and 2008ax) and two SNe Ib (2008D and 1999ex). For SN 2008ax, we use the photometry from Taubenberger et al. (2011). We adopt their explosion date MJD 54528.80. We use a total reddening E(B − V) of 0.302 mag and a distance of 8.7 Mpc (Drout et al. 2011). For SN 1999ex, we use the photometric data of Stritzinger et al. (2002). We adopt a reddening E(B − V) of 0.28 mag, a distance of 46.0 Mpc (Drout et al. 2011), and an explosion date of MJD 51480.0 (Stritzinger et al. 2002). See Sect. 2 for details. |
2 Observational data
Our model sample includes both H-rich and H-deficient ejecta, associated with SNe IIb and Ib. Observed SNe IIb/Ib encompass a range of light curve properties, in particular in terms of pre-maximum optical brightness. SN 1993J (IIb) is bright early on, while SN 2008ax (IIb) is faint early on. Similarly, SN 2008D (Ib) is bright early on, while SN 1999ex (Ib) is faint (Fig. 1).
The focus in the present paper is to see what progenitor/explosion properties can lead to a bright SN soon after explosion, as seen for SNe 1993J and 2008D. We will thus compare our models to these two SNe.
For SN 1993J, we use the photometry of Richmond et al. (1996) and the spectra from Matheson et al. (2000). We adopt a distance of 3.63 Mpc and a reddening E(B − V) = 0.08 mag (Richmond et al. 1994). For the explosion date, we adopt MJD 49074.0 (Lewis et al. 1994).
For SN 2008D, we use the photometry and optical spectroscopy from Soderberg et al. (2008) and Modjaz et al. (2009). For the explosion date, we adopt the time of the X-ray burst, i.e. MJD 54474.57. We adopt a reddening E(B − V) of 0.613 mag and a distance of 30 Mpc (Drout et al. 2011). The published optical spectra of SN 2008D suggest a non-monotonic colour evolution in the blue because the relative flux of spectra obtained within 0.1 d of each other have a distinct colour. These features are suggestive of a problem with the relative flux calibration. For our comparisons, we only use epochs that yield a smoothly varying sequence in optical colour.
3 Numerical setup
In this section, we first describe the computation of the evolution of our massive star models up to the point when we trigger the explosion (Sect. 3.1). We then present the approach for simulating the explosion (Sect. 3.2) and the evolution of the SN radiation and ejecta properties up to a few days/weeks (Sect. 3.3).
3.1 Progenitor evolution
Two different approaches/codes are used for the evolution of the progenitor star. The first approach employs the code MESA (Paxton et al. 2011, 2013, 2015) and is used to produce H-rich progenitors. The second approach uses the code BEC (see Yoon et al. 2010 and references therein for details) and is used to produce He-rich (and H-deficient) stars. Progenitor properties for our model set at the time of the piston trigger are illustrated in Fig. 2 and Fig. A.1.
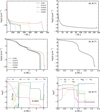 |
Fig. 2 Left column: density structure vs. radius (top) and mass (middle) for the model set of H-rich progenitors. The composition for the main species is shown in the bottom panel. The composition profiles are shown for all H-rich models in Fig. A.1. All these MESA models are evolved until iron core collapse. Right column: same as left column, but for the properties of the He-giant progenitor model He_R173. This He-giant model is evolved only until the onset of core neon burning. The colour-coding used for the composition (bottom row) differs for H-rich (left) and H-deficient models (right). |
3.1.1 H-rich binary progenitors
We study systems consisting on the zero age main sequence (ZAMS) of a 16 M⊙ primary star and a 14 M⊙ secondary star at solar metallicity (Z =0.02), with an initial orbital separation of 50, 100, 200, 300, 500, and 1000 R⊙. We model the evolution of each component from the ZAMS until iron core collapse of the primary star, using the binary-evolution implementation in MESA version 7624. The “Dutch” recipe is used to estimate the mass loss rate, with coefficient η = 1. Convection was followed according to the Ledoux criterion, with a mixing length parameter αMLT = 3, a semi-convection efficiency parameter αSC = 0.1 (Paxton et al. 2013, Eq. (12)), and an exponential overshoot with parameter f = 0.008 (Paxton et al. 2011, Eq. (2)). Both components are allowed to rotate, and the resulting effects of rotation on stellar structure, chemical mixing, angular momentum transport, and mass loss are accounted for according to the methods available in that MESA version.
Binary evolution was started with both components at synchronous rotation, and Roche-lobe overflow (RLOF) was followed according to the Ritter scheme with an implicit method, as described in Paxton et al. (2015). Similarly, the code follows the effects of tides and angular momentum transfer via RLOF on the rotation of both components.
The evolution is computed with the approx21.net nuclear network, which is composed of the basic CNO and α-chain isotopes up to 56Ni together with neutrons, protons, 56Cr, 54Fe, and 56Fe.2
In the course of their evolution, such stellar models inevitably become RSGs, fill their Roche lobes, and transfer mass to the companion star. This occurs after the He core has formed, which means that the main difference between the models is the structure of the H-rich envelope.
In the models selected, we obtain primary stars at death with a total mass of 4.46–5.14 M⊙; the H-rich envelope was nearly entirely lost during Case B and Case BB mass transfer. Their pre-SN radius varies monotonically with the initial orbital separation in our set. The values are 61, 152, 228, 385, and 601 R⊙, corresponding to orbital separations of 50, 100, 200, 300, 500, and 1000 R⊙, respectively. The mass of their extended H-rich envelope is 0.01–0.1 M⊙ and varies monotonically with pre-SN R⋆. The envelope density spans a factor of 10 and is higher in more massive (or more extended) progenitors. The same trend applies to the surface H mass fraction, which falls in the range 0.062–0.38. The He core mass increases monotonically with final mass and is in the range 4.37–4.95 M⊙.
Because one distinguishing property is the final radius, we call these H-rich models H_R61, H_R152, H_R228, H_R385, and H_R601. We also include the model H_R5, which results from a tighter initial orbital separation of 50 R⊙ and dies as a compact H-deficient star without a tenuous envelope. The model properties are documented in Fig. 2 and Fig. A.1, and in Table 1.
Summary of progenitor and ejecta properties.
3.1.2 He giant model
We also consider an H-deficient model in this study in order to gauge the possible influence on the early-time properties of Type Ib SNe. Recently, several authors (Eldridge et al. 2015; Kim et al. 2015; McClelland & Eldridge 2016; Yoon et al. 2017; Hirai 2017) have found that the final stellar properties of some binary low-mass He giants are compatible with those inferred for the progenitor of Type Ib SN iPTF13bvn (see also Bersten et al. 2014). Here we expand these studies to discuss the multi-band light curve and spectral properties of such He-giant star explosions.
We study a He-giant star model that was produced by the evolution of a pure He star of 2.8 M⊙ on the zero age He main sequence (the initial mass on the zero age H main sequence should be around 12 M⊙). The computation was performed with the BEC stellar evolution code. The adopted mass loss rate is the one given by Yoon et al. (2010) with a reduction of a factor of 5. This mass loss rate prescription is originally based on Hamann et al. (1995) for luminous Wolf–Rayet (WR) stars ( logL∕L⊙≥ 4.5) and Hamann et al. (1982) for less luminous helium stars. The simulations used the OPAL opacity tables of Iglesias & Rogers (1996). Unlike MESA, the BEC code does not go all the way to iron core formation and collapse. Here the BEC simulation was stoppedat the onset of core neon burning, which is merely a few years prior to core collapse (this model would most likely form an ironcore). Hence the global properties of the star, and in particular its envelope structure are settled; only the inner core will evolve in the remaining years of evolution. At the onset of core neon burning, this H-deficient star has a mass of 2.73 M⊙ and a surface radius of 173R⊙, and helium represents 35% of its total mass (see Fig. 2 and Table 1).
A He star with such a low mass can only be produced in a close binary system. By the time of explosion, the He star would usually havea companion, which may be a main sequence star or a compact object. The size of the He star would therefore be limited by the Roche radius, and it would be difficult to evolve into a He giant with a surface radius of 173 R⊙ (Yoon et al. 2010). However, there is the possibility that such a He star can be unbound from the binary system before it explodes if the order in which the two stars explode is reversed (Pols 1994). First, a He star would be produced by mass transfer from the primary star. Second, the secondary star that gained mass may evolve faster than the primary star and explode first. The terminal explosion of the secondary star and the resulting neutron star kick may disrupt the binary system, leaving the He star isolated. The probability of this SN reversal must be low, but it is not negligible.
In this He-giant star model, the large surface radius is a result of the very compact (and low-mass) core; this is the H-deficient counterpart of single stars of ~10 M⊙ stars that die as electron-capture SNe. Envelope inflation is, however, predicted in higher mass stars like H-deficient WR stars (Ishii et al. 1999; Petrovic et al. 2006; Gräfener et al. 2012; McClelland & Eldridge 2016). In high-mass stars, the concomitance of high luminosity and large envelope opacity places the star close to or above the Eddington limit at some depths within the envelope. Consequently, to preserve hydrostatic equilibrium, the stellar envelope may inflate and lower the opacity, producing surface radii of a few R⊙ (Yoon 2015), and perhaps up to ~10 R⊙ (see e.g. Groh et al. 2013). These radii are much smaller than for the low-mass He-giant model discussed here.
3.2 Simulation of the explosion
For the H-rich models, the MESA simulations were stopped when the maximum infall velocity (somewhere within the iron core) reached 1000 km s−1. At that time we remapped the MESA model into V1D (Livne 1993; Dessart et al. 2010b,a). The V1D simulations use 1000–1500 grid points. Near the stellar surface, we use a mass resolution of 10−6 –10−5 M⊙ to resolve the low-density outer layers; this is crucial in progenitors with extended low-density outer regions. Although such massive star progenitors may possess a sizeable wind mass loss rate at the time of explosion, we consider only explosions within a vacuum. Interaction with a wind would enhance the early time luminosity, produce bluer colours, and might inhibit the presence of ejecta material at high velocities. This limitation is to be considered when confronting models to observations, for example, of SN 1993J (Sect. 6).
In all cases the explosion is triggered by moving a piston at ~ 15 000 km s−1 at the inner boundary, which we place at the location where the entropy rises outward from the centre to 4 kB baryon−1. This location is typically in the outer part of the Si-rich shell, just below the O-rich shell, and located around 1.5–1.7 M⊙ in these models.
In these H-rich ejecta (whose progenitor evolution was continued until core collapse), explosive nucleosynthesis takes place leading to the production of 56Ni in the innermost, densest, layers. At 1000 s after the explosion was triggered, we artificially mix the 56Ni outwards. Starting at the base, we step through each ejecta mass shell mi and mix all mass shells within the range [mi, mi + δm] with δm = 0.3M⊙. To preserve the normalisation of the sum of all mass fractions to unity in each mass shell, we adjust the H mass fraction. In addition, to smear the composition profiles, we repeat the process for all species using δm = 0.05M⊙. We use this approach to preserve the composition of the outer ejecta layers where only a small amount of H may remain. In practice, this adopted56Ni mixing is quite weak, producing a delayed rise in the light curve in compact progenitor models, and lines of moderate width at maximum (see below, and also Dessart et al. 2012). With the adopted weak mixing, we can better gauge the influence of the shock-deposited energy in extended progenitor stars.
For the He-giant star model, the BEC simulation was stopped at the onset of core neon burning. Further evolution would primarily impact the core layers. Here we focus on the early time ejecta and radiation evolution (the first week after shock breakout) so the exact properties of the inner ejecta layers are irrelevant. In V1D, we set the piston at a Lagrangian mass of 1.4 M⊙ and produce an ejecta with 1051 erg. Because theshock only crosses low-density layers, there is no explosive burning and no 56Ni is produced.We perform no mixing for this model. To test the influence of the extended envelope on the SN radiation, we simulate a variant of this model, but with the progenitor envelope truncated at a radius of 11 R⊙ (corresponding to a density of ~ 10−5 g cm−3). The original model is called He_R173 and its truncated version is called He_R11.
A summary of the ejecta properties of our model set is given in Table 1.
3.3 Radiative transfer simulations
When the V1D simulations have evolved to ~1 d, we remap them into the non-local-thermodynamic-equilibrium (nLTE) time-dependent radiative-transfer code CMFGEN (Hillier & Miller 1998; Dessart & Hillier 2005, 2008; Hillier & Dessart 2012; Dessart et al. 2013). At this time the ejecta are in homologous expansion. We proceed for these SNe IIb/Ib models as described in Dessart et al. (2015b, 2016b). The notable distinction is that we are only interested in the impact of the progenitor outer envelope properties on the SN radiation, which is most visible early after shock breakout.
For the H-rich models, which synthesise some 56Ni during the explosion, we discuss the evolution up to bolometric maximum, which occurs at about 20–30 d. We had difficulties converging model H_R601 when starting at 1 d after shock breakout, but were able to proceed when starting at 3 d.3 Hence, we present results for model H_R601 starting at 3 d; for all the other models, our CMFGEN results start at 1 d after shock breakout.
To expedite the simulations of the He-giant star model, we trim the inner ejecta of models He_R173 and He_R11 to exclude the inner regions below 5000 km s−1. This is justified since there is no 56Ni in the model, the inner regions do not have the right properties since the progenitor star was not evolved until core collapse, and finally in that model we focus on the early times when the SN radiation emerges from the outer layers (and are not influenced by the properties of the deeper regions). Consequently, these models become optically thin within a week of shock breakout and we show their evolution only during that first week.
Similarsimulations for smaller progenitor stars (R⋆ ≲ 10R⊙), based on models by Yoon et al. (2010), have been presented in Dessart et al. (2011, 2015b, 2016b).
4 Shock propagation in stars with an extended envelope
4.1 Preamble
The explosion of massive stars with extended envelopes has been discussed in the context of Type IIb SNe. Nomoto et al. (1993), Podsiadlowski et al. (1993), Woosley et al. (1994), and Blinnikov et al. (1998) presented radiation-hydrodynamics and/or radiative-transfer simulations of terminal explosions of supergiant progenitor models largely stripped of their H-rich envelope. The overall consensus for SN 1993J is on a progenitor star with a 4 M⊙ He core surrounded by a ~0.2 M⊙ H-rich envelope extending out to ~500 R⊙. More recently, similar supergiant stars with a low total mass of just a few solar masses have been invoked to explain the light curve of SN 2011dh (Bersten et al. 2012). Similar results were obtained by Ergon et al. (2014) using additional constraints from spectra. The impact of an extended envelope on the SN radiation has also been discussed by Nakar & Piro (2014).
There isthus a consensus concerning the explosions of massive stars with extended low-density envelopes and their SN light curve. However, little has been shown about the shock propagation through the envelope and in particular the impact on the temperature(or internal energy) of the shocked envelope. Secondly, much attention has been paid to H-rich progenitors, but it is also possibleto form He-giant stars (McClelland & Eldridge 2016; Sect. 3.1.2); the results highlighted for some Type IIb SNe should also apply to some Type Ib SNe. In Sect. 5, we discuss the impact on spectra, which has not been done before. The spectral energy distribution, the morphology of line profiles, and the ions influencing the spectral formation all bear an imprint of the shock-deposited energy and of the dense shell formed by the reverse shock.
4.2 Results
We start with the results for the He-giant star model. Figure 3 shows multi-epoch snapshots of the density (top), temperature(middle), and velocity (bottom) versus mass as the shock propagates through the star. For up to about 20 min, the shock propagates within the He core, and steepens as it reaches the steeply declining density at its outer edge, around 2.5 M⊙ (Fig. 2). Subsequently, as the shock enters the extended, flat-density He-rich envelope, it decelerates. The pressure build-up behind the shock leads to the formation of a reverse shock, which also strengthens the forward shock. We thus see the presence of both a decelerating forward shock moving outward (in mass space) into the extended envelope and a reverse shock moving inwards (in mass space) into the He-core material. In model He_R173, the forward shock breaks out of the star (i.e. emerges) ~2 h after the piston trigger. At that time the reverse shock is still present deep inside the progenitor He core, although it is by then very weak (see velocity panel).
The contrast in envelope properties is striking when we compare the density/temperature profiles for model He_R173 (solid line) with the results for the truncated variant (model He_R11, dashed line). This is illustrated at multiple epochs during shock propagation through the envelope (Fig. 3). Figure 4 shows this contrast well after breakout in both models, specifically at 1.2 d, and this time in radial space. The model He_R173 from the extended progenitor is not yet in homologous expansion, primarily because of the surviving reverse shock. This reverse shock has led to the formation of a slow dense shell (at around 10 000 km s−1, and with little mass beyond it), while model He_R11 shows a smooth density profile with more mass at very high velocities (beyond 15 000 km s−1). The outer ejecta temperature in model He_R173 is typically 0.2–0.3 dex greater than in model He_R11. The corresponding energy excess in those outer layers, which suffers little degradation from expansion cooling, will have a strong impact on the SN light curve at early times.
The dynamical properties for the He-giant star explosions also apply to H-rich progenitors with an extended envelope. Figure 5 shows the density and temperature profiles at 1.2 d after the piston trigger in models H_R5, H_R61, H_R152, H_R228, H_R385, and H_R601. Progenitors with a greater H-rich envelope mass and extent produce ejecta at 1 d that have a higher temperature (or trapped radiative energy) as well as a more massive and slower dense shell. In model H_R601 at 1.2 d, the outer ejecta temperature is even greater than in the inner ejecta. In that model the reverse shock decreased to a velocity of 8000 km s−1, and has therefore decelerated a sizeable fraction of the He rich layers. Figure 5 shows this and other features for model H_R601, together with the H-rich model with the lowest amount of hydrogen and the smaller progenitor radius (model H_R61; model H_R5 is more compact, but it has no residual hydrogen).
Just as in RSG star explosions leading to Type II-Plateau SNe, the shock-deposited energy within the envelope is weakly degraded by expansion cooling. The difference with RSGs and SNe II-Plateau is the much lower optical depth of these tenuous envelopes, whose mass does not exceed 0.1 M⊙ in our model set. By expanding, these layers will radiate their energy on a shorter timescale, boosting the SN luminosity for a short while. In addition, the reverse shock enhances the internal energy deposited in the He-core layers. These layers are located at a greater optical depth. They are also rich in 56 Ni, and therefore influenced by decay heating, so the exact impact of the reverse shock on the light curve is harder to determine.
In a different context, these notions are also relevant to pulsational-delayed detonation models of SNe Ia. The progenitor stars are then white dwarfs, which are much more compact, but the occurrence of a deflagration “pulse” followed by a detonation can give rise to an interaction between the detonating inner layers and the outer marginally unbound layers (Khokhlov 1991). The interaction converts kinetic energy into internal energy, with visible consequences up to bolometric maximum (Dessart et al. 2014).
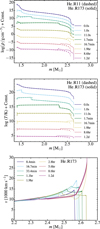 |
Fig. 3 Multi-epoch snapshots of the density (top), temperature (middle), and velocity vs. Lagrangian mass for model He_R173 (solid). For the top two panels, we include the results for model He_R11 (dashed). Bottom panel: different epochs and only the outer envelope. The time origin corresponds to the piston trigger (the piston mass cut is located at 1.4 M⊙). A reverse shock forms after ~20 min in the model with the extended low-density envelope. This reverse shock leads to the formation of a dense shell of 0.2 M⊙ at m = 2.4 M⊙. For better visibility, all profiles in the top two panels are shifted vertically by a constant. |
5 Impact on supernova radiation
5.1 Photometry
Figure 6 shows the bolometric light curve for our set of H-rich and H-deficient models computed with CMFGEN. The rise time of 20–30 d to a peak luminosity of ~ 1042 erg s−1 is comparable for all models because the ejecta mass, the ejecta kinetic energy, and the 56Ni mass are similar (Table 1).
In our set, progenitors with surface radii less than 300 R⊙ have comparable light curves beyond a day after shock breakout. Indeed, the V1D bolometric light curves (not shown), which are calculated at all times through shock breakout, show variations between these models only up to a day, with the luminosity being greater for more extended progenitors. This impact is limited to times of less than a day because the extended H-rich envelope is small, both in mass and extent.
For model H_R385, the luminosity boost is clearly visible at 1 d and persists for about a week. In model H_R601, the luminosity is ≳ 1042 erg s−1 for about two weeks after shock breakout, and is in excess of the subsequent 56Ni powered peak that occurs at ~30 d. The amount of stored radiation energy in the ejecta layers between 8000 and 16 000 km s−1 at 1.2 d after explosion is 5.8 × 1048 erg. This value is about one hundred times greater than for model H_R61. Such an energy radiated over a timescale of 20 d corresponds to a mean luminosity of ~ 3.3 × 1042 erg s−1 or ≲ 109 L⊙, which corresponds roughly to the value seen in the light curve.
A luminosity boost is also obtained for the explosion of the He-giant star. Model He_R173 shows a luminosity ≳ 1042 erg s−1 for about a week. This value is between those of models H_R385 and H_R601. In all three cases, the luminosity boost stems from the excess internal energy available in the outer ejecta layers at 1 d, which itself scales with the extent and mass of the tenuous progenitor envelope (Figs. 4–5).
The multi-band light curves of model H_R601 show a high brightness in all bands at early times (top right panel of Fig. 6). From U to K, the rise time to the first maximum increases: the blue filters have their maximum at the first epoch computed at 3.6 d, and redder filters peak later, with the latest being 8 d forthe K band. The SN is initially very blue and reddens with time as the ejecta/photosphere cools and expands after breakout. It fades in the blue (e.g. the U-band magnitude fades by 4 mag during the first two weeks), but its magnitude is nearly constant in the near-IR (e.g. the K-band magnitude is between − 19.5 and − 20.0 mag for the first 30 days). After about two weeks, the energy/power from 56Ni decay causes the rebrightening of the SN in all bands, but with a negligible associated change in colour.
All optical and near-IR light curves have therefore two peaks during the first 30 days. The first peak is a consequence of cooling and expansion after shock breakout. The second peak is caused by reheating from 56Ni decay and expansion. The two peaks are more obvious in redder filters and for progenitors with more extended/massive envelopes. This double-peak morphology is a natural consequence of the core-halo structure of the progenitor star and has been clearly observed in SN 1993J (Nomoto et al. 1993; Podsiadlowski et al. 1993; Woosley et al. 1994; Nakar & Piro 2014).
The middle and bottom rows of Fig. 6 compare the photometric properties of all models, illustrating further what has been presented above. Relatively compact progenitors follow a similar photometric path. In contrast, explosions of extended stars stand apart and show a strong sensitivity to the initial conditions. This is seen in brightness, but perhaps even more vividly in terms of colour. Model H_R601 stays 2–3 mag bluer than more compact progenitor models.
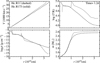 |
Fig. 4 Comparison of the velocity, temperature, density, and Lagrangian mass vs. radius for models He_R173 (solid) and He_R11 (dashed) at 1.2 d after the piston trigger (see text for discussion). |
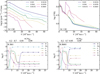 |
Fig. 5 Top row: Comparison of the density and temperature profiles at 1.2 d for the H-rich models. The more massive and extended is the low-mass H-rich envelope, the greater is the outer ejecta temperature. Bottom row: Composition profiles for models H_R61 and H_R601 at 1.2ḋ (see also Fig. B.1). The dashed line corresponds to 56Ni. This time corresponds to the time of remapping into CMFGEN. |
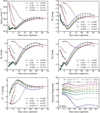 |
Fig. 6 Evolution of the bolometric luminosity (top left), the absolute magnitude in the U (top right), V (middle left), R (middle right) bands, and the (U − V) colour for our set of models. We also add the UBV RIJHK light curves for model H_R601 (bottom right). |
5.2 Spectroscopy
To date, time-dependent radiative transfer simulations of explosions from extended stars have been limited to light curves. In this section, we discuss the associated spectral evolution, and start with a description of the results for models H_R61 and H_R601 (Fig. 7).
Model H_R61 shows properties that are analogous to the Type IIb SNe from compact WR progenitor stars (see e.g. Dessart et al. 2016b). The small amount of hydrogen (about 0.004 M⊙) present in the outermost ejecta layers (beyond ~14 000 km s−1; Fig. B.1) gives rise to a strong Hα line for ~10 d, which survives as a small absorption dip at 25 d (bottom row of Fig. 7). This dip recedes in velocity space down to about − 14 000 km s−1, which is the velocity at the base of the H-rich ejecta. As expected from the discussion above, the model colour is quite red at all times, with little flux blueward of the U band.
In contrast, model H_R601 shows completely different spectral properties from model H_R61 (compare top right and top left panels of Fig. 7). These results are also different from those based on the compact WR progenitors of Yoon et al. (2010).
Model H_R601 is extremely blue early on, with the peak of the flux shortward of the U band, well into the ultraviolet at ~1200 Å at 4 d. At the photosphere, the velocity is 16 200 km s−1, the temperature is 17 500 K, and the density profile is very steep (Fig. 5). Such high temperatures are typical of RSG starexplosions at 1–2 d after shock breakout. Consequently, the spectral features are very weak (little absorption and emission), little line blanketing occurs in the optical, and the spectrum appears blue and featureless. This is reminiscent of the earliest spectrum of SN 1993J (Matheson et al. 2000; see Sect. 6.1). At 3–4 d in model H_R601, we see spectral lines similar to those seen in the earliest spectra of Type II-Plateau SNe (Quimby et al. 2007; Dessart et al. 2008; Gal-Yam et al. 2011), with He II 4686 Å, He I 5875 Å, and Hα. It takes model H_R601 two weeks to redden to the same colour as model H_R61 (see also Fig. 6). Other differences between these two models are revealed by Hα (bottom panels of Fig. 7). In model H_R601, Hα is visible even at 25 d, with an absorption that ranges between − 16 000 km s−1 and − 8000 km s−1. This corresponds to the velocity span of the H-rich dense shell (Fig. B.1).
The reverse shock in model H_R601 slows down the He-core material so that the He-rich shell stretches out to about 8000 km s−1. In the models with lower envelope radius/mass, the outer edge of the He core is located at greater velocities since the reverse shock is weaker or even absent (model H_R5). Although the formation of He I lines is complicated (sensitive to non-thermal excitation and 56Ni mixing), this different stratification in velocity space provides a possible explanation for the lower absorption velocities of He I 5875 Å in Type IIb compared to Type Ib SNe (Liu et al. 2016).
Also shown in Fig. 7 is the sizeable peak blueshift of the Hα line. This originates from an optical depth effect (Dessart & Hillier 2005) and is a generic property of SN spectra (Anderson et al. 2014), even present in Type IIn SNe (Zhang et al. 2012; Dessart et al. 2015a). This effect is predicted in spherically symmetric ejecta; asphericity is not necessary.
For He-giant star explosion model He_R173, the spectral evolution is comparable to that of model H_R601, the obvious difference being the absence of H I Balmer lines (Fig. 8). The spectrum is blue and featureless at early times. At 2 d, the spectral energy distribution peaks in the ultraviolet, over the range 1000 − 2000 Å. At 1–2 d, we see He II 4686 Å (whose peak emission is blueshifted by about − 15 000 km s−1) as well as multiplets of N III at 3940 Å and 4640 Å. Later on, as the photosphere cools the spectrum shows lines of He i, typical of Type Ib SNe (Fig. 8). In model He_R11 (i.e. the trimmed version of the He-giant model He_R173), the spectra are redder at all times and exhibit the presence of numerous lines including He i, but also of metals; the spectra are never as blue and featureless as for model He_R173. Contrary to standard SNe Ib around maximum light, these He I lines are produced without any contribution from non-thermal processes—there is no 56Ni in the ejecta model He_R173.
For both H-rich and H-deficient progenitors, we therefore find that the presence of an extended and tenuous envelope has a strong influence not only on the light curve (modulation of the early-time luminosity and colour), but also on the spectra (modulationof chemical stratification in velocity space and ionisation that impact the spectral energy distribution and line profiles).
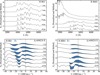 |
Fig. 7 Top row: Spectral evolution of models H_R61 (left) and H_R601 (right) in the ultraviolet and optical ranges from 2–4 d until 25 d after explosion. Bottom row: Evolution of the Hα region in velocity space up to 25 d after explosion for model H_R61 (left) and H_R601 (right). The shaded area corresponds to the contribution from Hα. In practice, we compute the formal solution of the radiative transfer equation for each model but without the bound-bound transitions from H i. The shaded area corresponds to the flux offset between that solution and the solution for the model that accounts for all bound-bound transitions. |
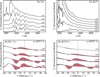 |
Fig. 8 Spectral evolution for models He_R11 (left) and He_R173 (right) covering the first week after explosion. The top panels show the ultraviolet and optical ranges and the bottom panels show the region around 5875 Å; the P Cygni profile to the red of He I 5875 Å is due to He I 6678 Å. Since these ejecta models do not contain any 56Ni, the presence of He I lines is not a result of non-thermal effects (see also Dessart et al. 2011). Blue featureless spectra in Type Ib SNe are compatible with a giant progenitor star, like our model He_R173. |
6 Comparison to observations
Explosions from progenitors with a core-halo structure can produce SNe with much diversity in light curve and spectral properties. Progenitors may vary in their global properties (e.g. mass, radius, composition), but also in their internal structure (e.g. density profile within the low-density extended H-rich or He-rich shell). Once exploded, these stars may produce ejecta with a different kinetic energy at infinity, 56Ni mass, and different composition mixing. Finally, the explosion may depart significantly from spherical symmetry (see e.g. evidence of this from light echoes; Rest et al. 2011).
Becauseof this expected diversity and our limited set of simulations, we use our results to study qualitative aspects of observations. Quantitative offsets that can be understood by invoking slight adjustments to the above parameters are not a major issue. Slight variations inexplosion energy and ejecta mass can impact the rise time to maximum, the spectral line widths, or the light curve width. Variations in 56Ni mass and mixing may impact the photometric brightness, colours, and spectral line widths. The impact of such variations has been explored in Dessart et al. (2015b, 2016b).
6.1 SN 1993J
Figure 9 shows the comparison of our models with the observations of SN 1993J. This SN shows two phases of high brightness. The first extends over the first 10 d and is powered by shock-deposited energy in the outer ejecta. The second is powered by 56Ni decay and causes the bolometric maximum at about 20 d after explosion. During the fading from the first peak, SN 1993J reddens with time. During the second maximum, its colour changes little.
In our model set, only the models from extended progenitors (H_R385 and H_R601) yield properties qualitatively similar to SN 1993J. They show a relatively high brightness in all bands during the early post-breakout phase, for one week in H_R385 and for about two weeks in H_R601. This excess is lower (higher) than observed for model H_R385 (H_R601). The 56Ni powered peak is of comparable brightness for models and for observations. It occurs 10–15 d later in the models (which also overestimate the light curve width since it correlates with the rise time). In model H_R601 and in the observations, the R-band magnitude is comparable during the first and the second maximum. However, SN 1993J is bluer in the optical during the 56Ni powered peak. Overall, our models show a greater variation in colour as they evolve through the first and the second peaks. While the colour offset during the first peak can be resolved by invoking different progenitor envelope properties, the colour offset during the 56Ni powered peak is harder to explain. The mixing adopted here affects only 56Ni and therefore should not alter the magnitude of line blanketing much (i.e. we do not mix other metals into the outer ejecta). One possibility is the extra contribution of radiation from the SN shock going through the progenitor wind (Fransson et al. 1996; Matheson et al. 2000); this interaction is ignored in our work because we assume that the ejecta expands in a vacuum.
Spectroscopically, model H_R601 shares a number of properties with the observations of SN 1993J. The model reproduces the blue featureless spectra at early times, although the model is too blue during the first week. The weak absorption/emission of spectral lines is a consequence of forming in an atmosphere with a steep density profile. Also, just as in Type II-P SNe detected very early, we see the presence of He II 4686 Å (see e.g. the early-time observations of SN 2006bp or SN 1999gi and associated models in Dessart et al. 2008). Unlike Type II-P SNe, the colour evolution is rapid, although the model reddens more than observed during the first two weeks; this may in part be due to the weak 56Ni mixing in our model, which causes a delayed rebrightening. The reddening is associated with a visible strengthening of line blanketing in the optical range. At the last epoch shown (i.e. 45.6 d), the correspondence between the observations and the model H_R601 is quite good.
We can also identify more subtle properties. The absorption trough of Hα shows the same width at all times. That width is a good tracer of the velocity extent of the dense shell formed by the reverse shock. A progenitor without an extended tenuous envelope shows instead a broad Hα absorption that continuouslynarrows until 20 − 30 d (see model H_R61 in Fig. 7). Furthermore, the strength of the Hα absorption is overestimated by the model, and the same holds for other lines (e.g. the Ca iI 8500 Å triplet). This might be additional evidence that some excess radiation, perhaps from an interaction with the progenitor wind, is contaminating the SN radiation. Also, our model underestimates the strength of He I 6678 Å and 7068 Å, perhaps because 56Ni is insufficiently mixed or the progenitor He-shell mass is too small. Interestingly, model H_R601 overestimates the strength of O I 7774 Å and of C I lines located red-ward of Ca II 8500 Å. Our progenitor model may have a CO core that is too large.
Despite these moderate deficiencies, model H_R601 is unlike any other SN IIb resulting from compact WR progenitors. The greatest difference is not seen during the 56Ni powered peak (whose luminosity is not affected by the presence of a low-density extended progenitor envelope), but during the early post-breakout phase. All the models we presented in Dessart et al. (2011, 2012, 2015b, 2016b) have red colours and show strong signs of line blanketing at early times (i.e. during the first two weeks after explosion). Model H_R601 shows that an extended progenitor can produce blue and featureless spectra (as well as blue optical colours) at early times, as seen most vividly in SN 1993J.
Finally, the progenitor model of H_R601 corresponds to a star with an effective temperature of 4300 K. This value is compatible with the inferences of Aldering et al. (1994) based on pre-explosion photometry of the SN site.
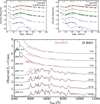 |
Fig. 9 Comparison of the multi-band light curves of models H_R385 and H_R601 and of multi-epoch optical spectra of model H_R601 with the observations of SN 1993J (the photometry is from Richmond et al. (1996) and the spectra from Matheson et al. (2000)). In this figure, we either correct the model or the observations for distance, reddening, and redshift of SN 1993J (see Sect. 2 for details). |
6.2 SN 2008D
In this section, we compare model He_R173 with the observations of SN 2008D. The optical maximum at 17 d after explosion (Soderberg et al. 2008; Modjaz et al. 2009) is probably powered by ~0.07 M⊙ of 56Ni (Mazzali et al. 2008). If this is the case, the contribution from decay power is already strong at 5 d since it causes the SN to be only 1 mag fainter than at maximum. This implies that 56Ni is efficiently mixed into the outer ejecta layers.
Our simulation is limited to the first week after explosion and does not include 56Ni, so the comparison is pertinent prior to the rebrightening of SN 2008D. Figure 10 shows the multi-band light curves and multi-epoch spectra for the model He_R173 and the observations of SN 2008D. With our adopted distance and reddening, we see that model He_R173 is too luminous and also too blue at the earliest times. A He-giant star with an envelope of lower mass/extent could remedy this problem.
Model He_R173 shows a very blue and quasi featureless spectrum early on, which is also a striking property of SN 2008D. The model shows He II 4686 Å and N III lines at 3940 Å and 4640 Å. It is not clear whether they are observed because of the offset in wavelength and the mismatch in line strength. Our approach assumes spherical symmetry, while light echoes of the Type IIb SN associated with Cas A clearly shows that the SN spectral appearance can vary with the viewing angle (Rest et al. 2011). Furthermore, the detected polarisation around light curve maximum and at nebular times suggests that the ejecta of SN 2008D is asymmetric (Maund et al. 2009; Tanaka et al. 2009b). Modjaz et al. (2009) suggests the presence of C III and O III lines. Their SYNOW spectrum matches the observations well. It is surprising, however, that a Type Ib SN progenitor, rich in He and N (and thus depleted in C and O at the surface) could show C III and O III lines at the earliest times, and at the same time not show He II 4686 Å. Spectral lines have their peak emission blueshifted when the ejecta is optically thick, especially early on (see Sect. 5.2). This feature, not predicted by SYNOW, may impact line identifications done with this code when the photospheric velocity is high and the ejecta optically thick. Through this first week, the He I lines strengthen in the model and remain very broad. These He I lines are present despite the absence of 56Ni in the model (see also Dessart et al. 2011).
Bersten et al. (2013) propose the mixing of 0.01 M⊙ of 56Ni out to 20 000 km s−1 to reproduce the SN 2008D light curve. They also consider explosions from extended stars, but their models are distinct from the low-mass He-giant star that we consider here. The weak and narrow He I lines observed in SN 2008D may be in tension with the strongly mixed model of Bersten et al. (2013) since the 56Ni that causes the early luminosity boost in their model would also enhance non-thermal effects in the outer layers. Consequently, very broad He I line absorption troughs could be expected at one week in this model; such broad lines are not seen.
Here we have performed a prospective study that shows encouraging similarities with the observations of SN 2008D, both photometrically and spectroscopically. In particular, high luminosity, blue optical colours, and featureless spectra at early times can be explained with a He-giant star progenitor. Such a progenitor structure may arise from a low-mass primary in a binary system (Pols 1994; Yoon et al. 2010; McClelland & Eldridge 2016; Yoon et al. 2017). For SN 2008D, this represents an alternative scenario to a high-mass progenitor (Mazzali et al. 2008; Tanaka et al. 2009a).
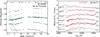 |
Fig. 10 Multi-band light curves (left) and multi-epoch spectra (right) for the He-giant star explosion model He_R173 (solid) and the observations (symbols) of SN 2008D. The time sequence is computed between 1 d and 7 d after explosion. In this figure, we either correct the model or the observations for distance, reddening, and redshift of SN 2008D (see Sect. 2 for details). |
7 Conclusions
We have presented models for the explosion of massive stars characterised by extended and tenuous envelopes. Our models are computed with the stellar evolution codes MESA and BEC, exploded with the radiation-hydrodynamics code V1D, and followed from ~1 d after shock breakout until 20–30 d with the radiative transfer code CMFGEN. We focus here on a limited set. Our H-rich progenitors result from the explosion of the primary star, evolved from a 16 M⊙ ⊕ 14 M⊙ system with an initial orbital separation between 100 and 1000 R⊙. We also present simulations for a 2.8 M⊙ He-giant star that may result from binary evolution.
These pre-SN models have a core-halo density structure. Outside of a dense core (≲ 1 R⊙) containing the bulk of the mass, a tenuous envelope (≲0.1 M⊙) with a flat density profile extends out to a radius as large as a few hundred R⊙. The greater the mass/extent of the tenuous envelope, the stronger is the reverse shock, the more massive is the dense shell, and the greater is the trapped radiation energy stored in the envelope at 1 d. While this energy is only a tiny fraction of the total ejecta kinetic energy at infinity, it is stored in an envelope of low/moderate optical depth. This energy is radiated prior to the 56Ni powered peak at 20–30 d and can therefore dramatically alter the SN luminosity at early times.
Our model H_R601 with a progenitor radius of 601 R⊙ and an ejecta mass of 3.5 M⊙ share many similarities with the observations of SN 1993J, including the luminosity boost for 1–2 weeks after shock breakout, the existence of two light-curve maxima in optical and near-IR bands, the blue and featureless spectra at early times, and the rather narrow (and constant) width of the Hα profile for the first 20–30 d. Our model shows some discrepancies which might be cured by invoking modest changes in ejecta mass, progenitor radius, chemical mixing, and by invoking the contribution of radiation from a persistent ejecta/wind interaction.
We also compare our He-giant explosion model to the early time observations of SN 2008D. Our model He_R173, with its progenitor radius of 173 R⊙, produces a much higher luminosity than compact WR star explosions at early times. Our model overestimates the early-time luminosity of SN 2008D; our He-giant model is somewhat too big.
We also present the first spectral calculations for such He-giant star explosions. The model predicts a blue spectrum at early times, as observed, but not as featureless. In particular, the model predicts the presence at 1–2 d of lines from He II and N III. This is more compatible with the expectations for a nitrogen-rich Wolf–Rayet star progenitor than the proposed identification of C III and O III (Modjaz et al. 2009) with no He II. Our model does not include any 56Ni, but predicts the presence of strong He I lines as soon as He II 4686 Å vanishes. As long as the photospheric conditions remain hot and ionised, He I lines can be thermally excited and may therefore be present without the influence of non-thermal processes (Lucy 1991).
He I lines are seen in SN 2008D, but they appear quite narrow at one week. This seems in tension with the model of Bersten et al. (2013), which invokes the presence of 0.01 M⊙ of 56Ni at 20000 km s−1 in order to explain the SN 2008D bolometric light curve. This should enhance the width of He I lines around bolometric maximum (Dessart et al. 2012).
Overall, a low-mass He-giant star offers attractive properties for Type Ib SNe that show a high luminosity during the first week after explosion, as well as a very rapid photometric evolution and a short rise time to bolometric maximum. Indeed, such He giants are fundamentally low-mass stars, that should have a very small iron core, and should synthesise modest amounts of 56Ni. They are also compatible with the inferences for Type Ib iPTF13bvn (Bersten et al. 2014; McClelland & Eldridge 2016). If the extent of the low-density envelope is also a function of the opacity (McClelland & Eldridge 2016), He-giant stars may statistically have a smaller radius at lower metallicities. Consequently, Type Ib SNe from He-giant stars could have early-time colours that are redder at lower metallicity.
Acknowledgements
L.D. thanks ESO-Vitacura for their hospitality. This work utilised computing resources of the mesocentre SIGAMM, hosted by the Observatoire de la Côte d’Azur, Nice, France. S.C.Y. acknowledges support from the Korea Astronomy and Space Science Institute under the R&D program (Project No. 3348-20160002) supervised by the Ministry of Science, ICT and Future Planning.
Appendix A: Composition profiles for all models
In Fig. A.1, we show the composition profiles at the time of collapse for each of the explosion models discussed in the
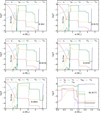 |
Fig. A.1 Composition profiles for our set of models (evolved with MESA or BEC) prior to explosion. In model He_R173, the composition is markedly different from other models because the star evolution is stopped at the onset of core neon burning. |
paper. The progenitor models are evolved from the main sequence with the codes MESA or BEC (see Sect. 3.1). In Fig. B.1, we show the composition profiles for the corresponding ejecta, computed with V1D (see Sect. 3.2).
Appendix B: Montageof spectra for all models
In Fig. B.2, we show a montage of spectra computed with CMFGEN for each model, from 1–2 d after explosion until
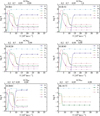 |
Fig. B.1 Same as Fig. A.1, but now for the ejecta produced with V1D. The time is 1.2 d after explosion and corresponds to the time of remapping into CMFGEN. |
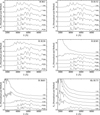 |
Fig. B.2 Spectral evolution computed with CMFGEN for models H_R61, H_R152, H_R228, H_R385, and H_R601 (H-rich models), and for the He-giant star model He_R173 (H-deficient). |
the timeof bolometric maximum for the H-rich models or up to a week for the H-poor model (see Sects. 3.1.2 and 5 for discussion).
References
- Aldering, G., Humphreys, R. M., & Richmond, M. 1994, AJ, 107, 662 [NASA ADS] [CrossRef] [Google Scholar]
- Anderson, J. P., Dessart, L., Gutierrez, C. P., et al. 2014, MNRAS, 441, 671 [NASA ADS] [CrossRef] [Google Scholar]
- Arnett, W. D., Bahcall, J. N., Kirshner, R. P., & Woosley, S. E. 1989, ARA&A, 27, 629 [NASA ADS] [CrossRef] [Google Scholar]
- Bersten, M. C., Benvenuto, O. G., Folatelli, G., et al. 2014, AJ, 148, 68 [NASA ADS] [CrossRef] [Google Scholar]
- Bersten, M. C., Benvenuto, O. G., Nomoto, K., et al. 2012, ApJ, 757, 31 [NASA ADS] [CrossRef] [Google Scholar]
- Bersten, M. C., Tanaka, M., Tominaga, N., Benvenuto, O. G., & Nomoto, K. 2013, ApJ, 767, 143 [NASA ADS] [CrossRef] [Google Scholar]
- Bianco, F. B., Modjaz, M., Hicken, M., et al. 2014, ApJS, 213, 19 [NASA ADS] [CrossRef] [Google Scholar]
- Blinnikov, S. I., Eastman, R., Bartunov, O. S., Popolitov, V. A., & Woosley, S. E. 1998, ApJ, 496, 454 [NASA ADS] [CrossRef] [Google Scholar]
- Chugai, N. N. 2001, MNRAS, 326, 1448 [NASA ADS] [CrossRef] [Google Scholar]
- Dessart, L., Audit, E., & Hillier, D. J. 2015a, MNRAS, 449, 4304 [NASA ADS] [CrossRef] [Google Scholar]
- Dessart, L., Blondin, S., Brown, P. J., et al. 2008, ApJ, 675, 644 [NASA ADS] [CrossRef] [Google Scholar]
- Dessart, L., Blondin, S., Hillier, D. J., & Khokhlov, A. 2014, MNRAS, 441, 532 [NASA ADS] [CrossRef] [Google Scholar]
- Dessart, L., & Hillier, D. J. 2005, A&A, 437, 667 [NASA ADS] [CrossRef] [EDP Sciences] [Google Scholar]
- Dessart, L., & Hillier, D. J. 2008, MNRAS, 383, 57 [NASA ADS] [CrossRef] [Google Scholar]
- Dessart, L., Hillier, D. J., Audit, E., Livne, E., & Waldman, R. 2016a, MNRAS, 458, 2094 [NASA ADS] [CrossRef] [Google Scholar]
- Dessart, L., Hillier, D. J., Li, C., & Woosley, S. 2012, MNRAS, 424, 2139 [NASA ADS] [CrossRef] [Google Scholar]
- Dessart, L., Hillier, D. J., Livne, E., et al. 2011, MNRAS, 414, 2985 [NASA ADS] [CrossRef] [Google Scholar]
- Dessart, L., Hillier, D. J., Woosley, S., et al. 2015b, MNRAS, 453, 2189 [NASA ADS] [CrossRef] [Google Scholar]
- Dessart, L., Hillier, D. J., Woosley, S., et al. 2016b, MNRAS, 458, 1618 [NASA ADS] [CrossRef] [Google Scholar]
- Dessart, L., Livne, E., & Waldman, R. 2010a, MNRAS, 408, 827 [NASA ADS] [CrossRef] [Google Scholar]
- Dessart, L., Livne, E., & Waldman, R. 2010b, MNRAS, 405, 2113 [NASA ADS] [Google Scholar]
- Dessart, L., Waldman, R., Livne, E., Hillier, D. J., & Blondin, S. 2013, MNRAS, 428, 3227 [NASA ADS] [CrossRef] [EDP Sciences] [Google Scholar]
- Drout, M. R., Soderberg, A. M., Gal-Yam, A., et al. 2011, ApJ, 741, 97 [NASA ADS] [CrossRef] [Google Scholar]
- Eldridge, J. J., Fraser, M., Maund, J. R., & Smartt, S. J. 2015, MNRAS, 446, 2689 [NASA ADS] [CrossRef] [Google Scholar]
- Ensman, L. M., & Woosley, S. E. 1988, ApJ, 333, 754 [NASA ADS] [CrossRef] [Google Scholar]
- Ergon, M., Sollerman, J., Fraser, M., et al. 2014, A&A, 562, A17 [NASA ADS] [CrossRef] [EDP Sciences] [Google Scholar]
- Folatelli, G., Bersten, M. C., Benvenuto, O. G., et al. 2014, ApJ, 793, L22 [NASA ADS] [CrossRef] [Google Scholar]
- Fransson, C., Lundqvist, P., & Chevalier, R. A. 1996, ApJ, 461, 993 [NASA ADS] [CrossRef] [Google Scholar]
- Gal-Yam, A., Kasliwal, M. M., Arcavi, I., et al. 2011, ApJ, 736, 159 [NASA ADS] [CrossRef] [Google Scholar]
- Gräfener, G., Owocki, S. P., & Vink, J. S. 2012, A&A, 538, A40 [NASA ADS] [CrossRef] [EDP Sciences] [Google Scholar]
- Gräfener, G., & Vink, J. S. 2016, MNRAS, 455, 112 [NASA ADS] [CrossRef] [Google Scholar]
- Groh, J. H. 2014, A&A, 572, L11 [NASA ADS] [CrossRef] [EDP Sciences] [Google Scholar]
- Groh, J. H., Georgy, C., & Ekström, S. 2013, A&A, 558, L1 [NASA ADS] [CrossRef] [EDP Sciences] [Google Scholar]
- Hamann, W.-R., Koesterke, L., & Wessolowski, U. 1995, A&A, 299, 151 [NASA ADS] [Google Scholar]
- Hamann, W.-R., Schoenberner, D., & Heber, U. 1982, A&A, 116, 273 [NASA ADS] [Google Scholar]
- Hillier, D. J., & Dessart, L. 2012, MNRAS, 424, 252 [NASA ADS] [CrossRef] [Google Scholar]
- Hillier, D. J., & Miller, D. L. 1998, ApJ, 496, 407 [NASA ADS] [CrossRef] [Google Scholar]
- Hirai, R. 2017, MNRAS, 466, 3775 [NASA ADS] [CrossRef] [Google Scholar]
- Iglesias, C. A., & Rogers, F. J. 1996, ApJ, 464, 943 [NASA ADS] [CrossRef] [Google Scholar]
- Ishii, M., Ueno, M., & Kato, M. 1999, PASJ, 51, 417 [NASA ADS] [Google Scholar]
- Kasen, D. 2010, ApJ, 708, 1025 [NASA ADS] [CrossRef] [Google Scholar]
- Khokhlov, A. M. 1991, A&A, 245, L25 [NASA ADS] [Google Scholar]
- Kim, H.-J., Yoon, S.-C., & Koo, B.-C. 2015, ApJ, 809, 131 [NASA ADS] [CrossRef] [Google Scholar]
- Lewis, J. R., Walton, N. A., Meikle, W. P. S., et al. 1994, MNRAS, 266, L27 [NASA ADS] [CrossRef] [Google Scholar]
- Liu, Y.-Q., Modjaz, M., Bianco, F. B., & Graur, O. 2016, ApJ, 827, 90 [NASA ADS] [CrossRef] [Google Scholar]
- Livne, E. 1993, ApJ, 412, 634 [NASA ADS] [CrossRef] [Google Scholar]
- Lucy, L. B. 1991, ApJ, 383, 308 [NASA ADS] [CrossRef] [Google Scholar]
- Matheson, T., Filippenko, A. V., Barth, A. J., et al. 2000, AJ, 120, 1487 [NASA ADS] [CrossRef] [Google Scholar]
- Maund, J. R., Fraser, M., Ergon, M., et al. 2011, ApJ, 739, L37 [NASA ADS] [CrossRef] [Google Scholar]
- Maund, J. R., Smartt, S. J., Kudritzki, R. P., Podsiadlowski, P., & Gilmore, G. F. 2004, Nature, 427, 129 [NASA ADS] [CrossRef] [PubMed] [Google Scholar]
- Maund, J. R., Wheeler, J. C., Baade, D., et al. 2009, ApJ, 705, 1139 [NASA ADS] [CrossRef] [Google Scholar]
- Mazzali, P. A., Valenti, S., Della Valle, M., et al. 2008, Science, 321, 1185 [NASA ADS] [CrossRef] [PubMed] [Google Scholar]
- McClelland, L. A. S., & Eldridge, J. J. 2016, MNRAS, 459, 1505 [NASA ADS] [CrossRef] [Google Scholar]
- Modjaz, M., Li, W., Butler, N., et al. 2009, ApJ, 702, 226 [NASA ADS] [CrossRef] [Google Scholar]
- Moriya, T. J., Liu, Z.-W., & Izzard, R. G. 2015a, MNRAS, 450, 3264 [NASA ADS] [CrossRef] [Google Scholar]
- Moriya, T. J., Sanyal, D., & Langer, N. 2015b, A&A, 575, L10 [NASA ADS] [CrossRef] [EDP Sciences] [Google Scholar]
- Nakar, E., & Piro, A. L. 2014, ApJ, 788, 193 [NASA ADS] [CrossRef] [Google Scholar]
- Nomoto, K., Suzuki, T., Shigeyama, T., et al. 1993, Nature, 364, 507 [NASA ADS] [CrossRef] [Google Scholar]
- Paxton, B., Bildsten, L., Dotter, A., et al. 2011, ApJS, 192, 3 [Google Scholar]
- Paxton, B., Cantiello, M., Arras, P., et al. 2013, ApJS, 208, 4 [NASA ADS] [CrossRef] [Google Scholar]
- Paxton, B., Marchant, P., Schwab, J., et al. 2015, ApJS, 220, 15 [Google Scholar]
- Petrovic, J., Pols, O., & Langer, N. 2006, A&A, 450, 219 [NASA ADS] [CrossRef] [EDP Sciences] [Google Scholar]
- Podsiadlowski, P., Hsu, J. J. L., Joss, P. C., & Ross, R. R. 1993, Nature, 364, 509 [NASA ADS] [CrossRef] [Google Scholar]
- Podsiadlowski, P., Joss, P. C., & Hsu, J. J. L. 1992, ApJ, 391, 246 [NASA ADS] [CrossRef] [Google Scholar]
- Pols, O. R., 1994, A&A, 290, 119 [NASA ADS] [Google Scholar]
- Quimby, R. M., Wheeler, J. C., Höflich, P., et al. 2007, ApJ, 666, 1093 [NASA ADS] [CrossRef] [Google Scholar]
- Rest, A., Foley, R. J., Sinnott, B., et al. 2011, ApJ, 732, 3 [NASA ADS] [CrossRef] [Google Scholar]
- Richardson, D., Branch, D., & Baron, E. 2006, AJ, 131, 2233 [NASA ADS] [CrossRef] [Google Scholar]
- Richmond, M. W., Treffers, R. R., Filippenko, A. V., & Paik, Y. 1996, AJ, 112, 732 [NASA ADS] [CrossRef] [Google Scholar]
- Richmond, M. W., Treffers, R. R., Filippenko, A. V., et al. 1994, AJ, 107, 1022 [NASA ADS] [CrossRef] [Google Scholar]
- Schlegel, E. M. 1990, MNRAS, 244, 269 [NASA ADS] [Google Scholar]
- Soderberg, A. M., Berger, E., Page, K. L., et al. 2008, Nature, 453, 469 [NASA ADS] [CrossRef] [PubMed] [Google Scholar]
- Stritzinger, M., Hamuy, M., Suntzeff, N. B., et al. 2002, AJ, 124, 2100 [NASA ADS] [CrossRef] [Google Scholar]
- Taddia, F., Sollerman, J., Leloudas, G., et al. 2015, A&A, 574, A60 [NASA ADS] [CrossRef] [EDP Sciences] [Google Scholar]
- Tanaka, M., Tominaga, N., Nomoto, K., et al. 2009a, ApJ, 692, 1131 [NASA ADS] [CrossRef] [Google Scholar]
- Tanaka, M., Yamanaka, M., Maeda, K., et al. 2009b, ApJ, 700, 1680 [NASA ADS] [CrossRef] [Google Scholar]
- Taubenberger,S., Navasardyan, H., Maurer, J. I., et al. 2011, MNRAS, 413, 2140 [NASA ADS] [CrossRef] [Google Scholar]
- Van Dyk, S. D., Garnavich, P. M., Filippenko, A. V., et al. 2002, PASP, 114, 1322 [NASA ADS] [CrossRef] [Google Scholar]
- Van Dyk, S. D., Zheng, W., Clubb, K. I., et al. 2013, ApJL, 772, L32 [NASA ADS] [CrossRef] [Google Scholar]
- Woosley, S. E., Eastman, R. G., Weaver, T. A., & Pinto, P. A. 1994, ApJ, 429, 300 [NASA ADS] [CrossRef] [Google Scholar]
- Yoon, S.-C. 2015, PASA, 32, 15 [NASA ADS] [CrossRef] [Google Scholar]
- Yoon, S.-C., Dessart, L., & Clocchiatti, A. 2017, ApJ, 840, 10 [NASA ADS] [CrossRef] [Google Scholar]
- Yoon, S.-C., Gräfener, G., Vink, J. S., Kozyreva, A., & Izzard, R. G. 2012, A&A, 544, L11 [NASA ADS] [CrossRef] [EDP Sciences] [Google Scholar]
- Yoon, S.-C., Woosley, S. E., & Langer, N. 2010, ApJ, 725, 940 [NASA ADS] [CrossRef] [Google Scholar]
- Zhang, T., Wang, X., Wu, C., et al. 2012, AJ, 144, 131 [NASA ADS] [CrossRef] [Google Scholar]
We consider that a model is H-rich if the corresponding progenitor has a large surface H mass fraction. Consequently, the observation of the corresponding star would likely reveal H I lines in the optical spectra. This can occur even if the total H mass is very small. In the corresponding Type IIb SN explosion, the Hα line may be strong even if the total H mass is as low as 0.001 M⊙ (Dessart et al. 2011).
In this nuclear network, 56Cr serves as a neutron-rich end product. It is produced by a fake electron capture reaction involving 56Fe and two electrons.
The problem is with the hot low-density outer ejecta layers where the dominance of scattering caused convergence difficulties. This affects only the model with the most extended tenuous envelope.
All Tables
All Figures
|
Fig. 1 Evolution of the U-and V -band absolute magnitudes for two SNe IIb (1993J and 2008ax) and two SNe Ib (2008D and 1999ex). For SN 2008ax, we use the photometry from Taubenberger et al. (2011). We adopt their explosion date MJD 54528.80. We use a total reddening E(B − V) of 0.302 mag and a distance of 8.7 Mpc (Drout et al. 2011). For SN 1999ex, we use the photometric data of Stritzinger et al. (2002). We adopt a reddening E(B − V) of 0.28 mag, a distance of 46.0 Mpc (Drout et al. 2011), and an explosion date of MJD 51480.0 (Stritzinger et al. 2002). See Sect. 2 for details. |
| In the text | |
|
Fig. 2 Left column: density structure vs. radius (top) and mass (middle) for the model set of H-rich progenitors. The composition for the main species is shown in the bottom panel. The composition profiles are shown for all H-rich models in Fig. A.1. All these MESA models are evolved until iron core collapse. Right column: same as left column, but for the properties of the He-giant progenitor model He_R173. This He-giant model is evolved only until the onset of core neon burning. The colour-coding used for the composition (bottom row) differs for H-rich (left) and H-deficient models (right). |
| In the text | |
|
Fig. 3 Multi-epoch snapshots of the density (top), temperature (middle), and velocity vs. Lagrangian mass for model He_R173 (solid). For the top two panels, we include the results for model He_R11 (dashed). Bottom panel: different epochs and only the outer envelope. The time origin corresponds to the piston trigger (the piston mass cut is located at 1.4 M⊙). A reverse shock forms after ~20 min in the model with the extended low-density envelope. This reverse shock leads to the formation of a dense shell of 0.2 M⊙ at m = 2.4 M⊙. For better visibility, all profiles in the top two panels are shifted vertically by a constant. |
| In the text | |
|
Fig. 4 Comparison of the velocity, temperature, density, and Lagrangian mass vs. radius for models He_R173 (solid) and He_R11 (dashed) at 1.2 d after the piston trigger (see text for discussion). |
| In the text | |
|
Fig. 5 Top row: Comparison of the density and temperature profiles at 1.2 d for the H-rich models. The more massive and extended is the low-mass H-rich envelope, the greater is the outer ejecta temperature. Bottom row: Composition profiles for models H_R61 and H_R601 at 1.2ḋ (see also Fig. B.1). The dashed line corresponds to 56Ni. This time corresponds to the time of remapping into CMFGEN. |
| In the text | |
|
Fig. 6 Evolution of the bolometric luminosity (top left), the absolute magnitude in the U (top right), V (middle left), R (middle right) bands, and the (U − V) colour for our set of models. We also add the UBV RIJHK light curves for model H_R601 (bottom right). |
| In the text | |
|
Fig. 7 Top row: Spectral evolution of models H_R61 (left) and H_R601 (right) in the ultraviolet and optical ranges from 2–4 d until 25 d after explosion. Bottom row: Evolution of the Hα region in velocity space up to 25 d after explosion for model H_R61 (left) and H_R601 (right). The shaded area corresponds to the contribution from Hα. In practice, we compute the formal solution of the radiative transfer equation for each model but without the bound-bound transitions from H i. The shaded area corresponds to the flux offset between that solution and the solution for the model that accounts for all bound-bound transitions. |
| In the text | |
|
Fig. 8 Spectral evolution for models He_R11 (left) and He_R173 (right) covering the first week after explosion. The top panels show the ultraviolet and optical ranges and the bottom panels show the region around 5875 Å; the P Cygni profile to the red of He I 5875 Å is due to He I 6678 Å. Since these ejecta models do not contain any 56Ni, the presence of He I lines is not a result of non-thermal effects (see also Dessart et al. 2011). Blue featureless spectra in Type Ib SNe are compatible with a giant progenitor star, like our model He_R173. |
| In the text | |
|
Fig. 9 Comparison of the multi-band light curves of models H_R385 and H_R601 and of multi-epoch optical spectra of model H_R601 with the observations of SN 1993J (the photometry is from Richmond et al. (1996) and the spectra from Matheson et al. (2000)). In this figure, we either correct the model or the observations for distance, reddening, and redshift of SN 1993J (see Sect. 2 for details). |
| In the text | |
|
Fig. 10 Multi-band light curves (left) and multi-epoch spectra (right) for the He-giant star explosion model He_R173 (solid) and the observations (symbols) of SN 2008D. The time sequence is computed between 1 d and 7 d after explosion. In this figure, we either correct the model or the observations for distance, reddening, and redshift of SN 2008D (see Sect. 2 for details). |
| In the text | |
|
Fig. A.1 Composition profiles for our set of models (evolved with MESA or BEC) prior to explosion. In model He_R173, the composition is markedly different from other models because the star evolution is stopped at the onset of core neon burning. |
| In the text | |
|
Fig. B.1 Same as Fig. A.1, but now for the ejecta produced with V1D. The time is 1.2 d after explosion and corresponds to the time of remapping into CMFGEN. |
| In the text | |
|
Fig. B.2 Spectral evolution computed with CMFGEN for models H_R61, H_R152, H_R228, H_R385, and H_R601 (H-rich models), and for the He-giant star model He_R173 (H-deficient). |
| In the text | |
Current usage metrics show cumulative count of Article Views (full-text article views including HTML views, PDF and ePub downloads, according to the available data) and Abstracts Views on Vision4Press platform.
Data correspond to usage on the plateform after 2015. The current usage metrics is available 48-96 hours after online publication and is updated daily on week days.
Initial download of the metrics may take a while.