| Issue |
A&A
Volume 612, April 2018
|
|
|---|---|---|
| Article Number | A38 | |
| Number of page(s) | 16 | |
| Section | Astrophysical processes | |
| DOI | https://doi.org/10.1051/0004-6361/201731692 | |
| Published online | 17 April 2018 | |
Gamma-ray emission from internal shocks in novae
1
Univ. Paul Sabatier, CNRS, Institut de Recherche en Astrophysique et Planétologie (IRAP),
31028
Toulouse Cedex, France
e-mail: This email address is being protected from spambots. You need JavaScript enabled to view it.
2
Univ. Grenoble Alpes, CNRS, Institut de Planétologie et d’Astrophysique de Grenoble (IPAG),
38000
Grenoble, France
3
Centre de Sciences Nucléaires et de Sciences de la Matière, IN2P3-CNRS and Univ. Paris-Sud,
91405
Orsay Cedex, France
4
Institut Supérieur de l’Aéronautique et de l’Espace (ISAE-Supaero),
10 avenue Édouard Belin,
31055
Toulouse Cedex, France
Received:
1
August
2017
Accepted:
11
November
2017
Abstract
Context. Gamma-ray emission at energies ≥100 MeV has been detected from nine novae using the Fermi Large Area Telescope (LAT), and can be explained by particle acceleration at shocks in these systems. Eight out of these nine objects are classical novae in which interaction of the ejecta with a tenuous circumbinary material is not expected to generate detectable gamma-ray emission.
Aim. We examine whether particle acceleration at internal shocks can account for the gamma-ray emission from these novae. The shocks result from the interaction of a fast wind radiatively-driven by nuclear burning on the white dwarf with material ejected in the initial runaway stage of the nova outburst.
Methods. We present a one-dimensional model for the dynamics of a forward and reverse shock system in a nova ejecta, and for the associated time-dependent particle acceleration and high-energy gamma-ray emission. Non-thermal proton and electron spectra are calculated by solving a time-dependent transport equation for particle injection, acceleration, losses, and escape from the shock region. The predicted emission is compared to LAT observations of V407 Cyg, V1324 Sco, V959 Mon, V339 Del, V1369 Cen, and V5668 Sgr.
Results. The ≥100 MeV gamma-ray emission arises predominantly from particles accelerated up to ~100 GeV at the reverse shock and undergoing hadronic interactions in the dense cooling layer downstream of the shock. The emission rises within days after the onset of the wind, quickly reaches a maximum, and its subsequent decrease reflects mostly the time evolution of the wind properties. Comparison to gamma-ray data points to a typical scenario where an ejecta of mass 10−5–10−4 M⊙ expands in a homologous way with a maximum velocity of 1000–2000 km s−1, followed within a day by a wind with a velocity <2000 km s−1 and a mass-loss rate of 10−4–10−3 M⊙ yr−1 declining over a time scale of a few days. Because of the large uncertainties in the measurements, many parameters of the problem are degenerate and/or poorly constrained except for the wind velocity, the relatively low values of which result in the majority of best-fit models having gamma-ray spectra with a high-energy turnover below ~10 GeV. Our typical model is able to account for the main features in the observations of the recent gamma-ray nova ASASSN-16ma.
Conclusions. The internal shock model can account for the gamma-ray emission of the novae detected by Fermi LAT. Gamma-ray observations hold potential for probing the mechanism of mass ejection in novae, but should be combined to diagnostics of the thermal emission at lower energies to be more constraining.
Key words: acceleration of particles / novae, cataclysmic variables / gamma rays: stars
© ESO 2018
1 Introduction
Gamma-ray emission at energies ≳100 MeV has now been detected from nine novae (Ackermann et al. 2014; Cheung et al. 2015, 2016b,a; Li et al. 2016; Li & Chomiuk 2016), and two candidates at the 2σ significance level were recently found in a re-analysis of the first 7.4 years of Fermi-LAT observations using the enhanced instrument performances provided by the Pass 8 event reconstruction scheme (Franckowiak et al. 2018). Whereas the first detection was associated with a nova eruption in a symbiotic system (V407 Cyg), all other detections have been associated with classical binary systems. Novae eruptions are known to eject part of the white dwarf envelope at velocities ~103–104 km s−1. In V407 Cyg, gamma-ray emission is thought to have occurred when this high-velocity material shocked the dense stellar wind from the red giant companion, accelerating a fraction of the swept-up particles to high energies by diffusive shock acceleration (Abdo et al. 2010). However, the companion in classical novae is a main sequence star with a very tenuous stellar wind, similar to the solar one; so, although a strong shock may be produced, no detectable gamma-ray emission is expected. Furthermore, the binaries are much tighter with orbital periods of approximately hours or less compared to years in the case of symbiotic systems. The rapid ≲1 day expansion of the white dwarf envelope to ~100 R⊙ engulfs the binary system in a common envelope during the eruption. Hence, interactions with the companion star also seem unlikely to explain high-energy emission on the observed timescales of weeks. The origin of the high-energy gamma-ray emission from classical novae is thus puzzling.
Although all novae models agree that mass loss is an important ingredient of the eruption, the exact sequence is not well constrained by theory. Shock ejection, envelope expansion and/or an outflow are all possible depending upon the rate of energy deposition in the optically thick envelope (Quataert et al. 2016). Prialnik (1986) found that the thermonuclear runaway at the onset of the eruption leads to the ejection of a fraction of the envelope, followed by the launch of a wind driven by radiation pressure due to continued nuclear burning at (super-)Eddington luminosities at the base of the envelope. This nova wind plays an important role in setting the timescale of the eruption by removing mass from the envelope (Kato & Hachisu 1994). The interaction of faster material with slower material ejected during various phases of the nova eruption might thus generate an internal shock liable to accelerate particles.
Strong observational evidence exists for internal shocks, as thoroughly reviewed by Metzger et al. (2014), who explored the physics of these shocks and their consequences on the emission of classical novae. The typical nova wind outflow rate is in the range 10−6 –10−3 M⊙ yr−1 for a total ejected mass in the range 10−7 –10−3 M⊙ (Kato & Hachisu 1994). Metzger et al. (2014) pointed out that the resulting densities at the shocks are high enough that X-ray emission from the shock-heated material is absorbed and reprocessed to optical wavelengths, providing a novel interpretation of the thermal emission from novae. The ionization structure associated with the reprocessing impacts the thermal bremsstrahlung emission in the radio, possibly supplemented by non-thermal synchrotron emission from shock-accelerated electrons (Vlasov et al. 2016). High densities favor non-thermal gamma-ray emission, via π0 production and decay in interactions of shock-accelerated protons with thermal protons (Metzger et al. 2015), in which case a weak neutrino signal is expected to be associated with the nova eruption (Metzger et al. 2016).
Here, inspired by the nova mass-loss sequence described by Prialnik (1986), we compute the gamma-ray emission resulting from shock acceleration when a nova wind propagates through slower material ejected at the onset of the nova eruption. This assumption allows us to derive the detailed hydrodynamical evolution of the shock and to associate it with a model for particle acceleration,along the lines we set out in Martin & Dubus (2013) for the case of V407 Cyg. We are then able to compute gamma-ray light curves and spectra. The comparison to Fermi-LAT observations of V407 Cyg, V1324 Sco, V959 Mon, V339 Del, V1369 Cen, and V5668 Sgr allows us to identify the regions of parameter space that are relevant to the gamma-ray emission of classical novae1 .
2 Hydrodynamics of the interaction
2.1 Ejecta and nova wind
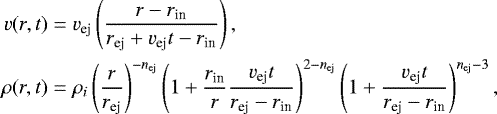
We assume that part of the white dwarf envelope is ejected at the onset of the thermonuclear runaway. By analogy with supernova explosions, we assume that this ejecta is in homologous expansion with a velocity v ∝ r and a density distribution ρ ∝ r−nej. Neglecting pressure effects (adiabatic expansion quickly cools the ejecta) and assuming spherical symmetry, the velocity and density of material in the ejecta follow from conservation of mass and momentum,
 (1) (2)
where rej (resp. rin ) is the outer (resp. inner) boundary of the ejected shell at t = 0, vej is the velocity of the outer boundary of the ejecta, and the normalization ρi is set by the total mass in the ejecta
 (3)
(3)
In the following, we assume that rin ≪ rej. The ejecta is then characterized by four parameters: Mej, vej , rej and nej .
The nova wind is characterized by a constant velocity vw and an exponentially decreasing mass-loss rate Ṁw over a typical timescale of approximately weeks. We identify the timescale
 (4)
(4)
which is the delay between the ejection of the envelope and the launch of this wind. Hence, t = 0 in Eqs. (1) and (2) corresponds to the onset of the interaction between the nova wind and the homologous ejecta (neglecting the time for the wind to reach the inner boundary of the ejected envelope, since we have set rin ~0).
2.2 Shell structure of the interaction
The propagation of the nova wind through the ejecta results in the formation of a forward shock in the ejecta and of a reverse shock in thenova wind, separated by a contact discontinuity. Metzger et al. (2014) found that these shocks are highly radiative for the typical parameters under consideration, in the sense that the timescale on which shock-heated material cools due to emission is fast compared to the timescale on which the shock propagates. We confirm this is indeed the case for our setup by computing the shock evolution in the adiabatic limit and deriving the associated radiative timescale, assuming a simple cooling function (Appendix A). We implicitly assume that radiation can indeed escape to cool the shock region. Preliminary calculations using a hydrodynamical code including radiative transfer (Dessart, priv. comm.) indicate nearly isothermal shock conditions are reached, as expected for efficient radiative cooling. In the following, we assume that the interaction is isothermal, and that radiative transfer and ionization balance set T ≈ 104 K.
The structure of the interaction region is greatly simplified in the isothermal limit (but see Sect. 3.3). The nova wind pushes through the ejecta a narrow shell of material composed of shocked wind and ejecta material (Fig. 1). This shell of swept-up material propagates at a velocity vs = drs∕dt. At the leading edge of the shell, the Mach number of the shock is
 (5)
(5)
where cs ≈ 10 km s−1 is the sound speed in the ejecta, v ≡ v(rs(t), t) is given by Eq. (1), and rs(t) is the location of the shell at time t. Similarly, the Mach number of the shock at the trailing edge of the shell is
 (6)
(6)
If maximumcompression of the shocked gas is achieved (but see Sect. 3.2), the density behind the forward shock is  with ρ ≡ ρ(rs(t), t) given by Eq. (2), and the density behind the reverse shock is
  with ρw defined by
  . In this case, the width of the shell Δrs can be approximated as
 (7)
(7)
in the limit Δrs ≪ rs, with Ms being the mass of swept-up material.
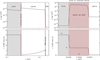 |
Fig. 1 Structure of the interaction between a wind and a homologous ejecta with ρ ∝ r−2 from a computation using PLUTO with an isothermal equation of state. The left panels show the density and the velocity of the material. The right panels zoom in on the internal shock structure at the interface between the wind and the ejecta. Another shock structure appears at the interface between the ejecta and the ISM at r ≈ 1.6 AU. |
2.3 Dynamical evolution of the shell
The shell dynamics are governed by conservation of momentum, pushed by the nova wind and slowed by the ejecta, neglecting gravity. The equation of motion is
![Mathematical equation: \begin{equation*} \fd{}{t}\left[M_{\textrm{s}}v_{\textrm{s}}\right]=\dot{M}_{\textrm{ej,s}} v+\dot{M}_{\textrm{w,s}}v_{\textrm{w}},\end{equation*}](/articles/aa/full_html/2018/04/aa31692-17/aa31692-17-eq10.png) (8)
(8)
where Ṁej,s (resp. Ṁw,s) is the rate at which swept-up ejecta (resp. wind) material is added to the shell and
 (9)
(9)
The contribution to the shell mass from the swept-up wind is
 (10)
(10)
and the contribution from the swept-up ejecta is
 (11)
(11)
Equation (8) is an integro-differential equation on rs that we solve numerically using a Runge-Kutta integration. Analytical solutions exist with additional assumptions (see Appendix B). We have verified the validity of our approach by comparing these analytical and numerical solutions to computations carried out with the hydrodynamical code PLUTO (Mignone et al. 2012).
We define tcatch as the time when the shell has propagated throughout the ejecta or, in other words, when Mej,s = Mej in Eq. (11). In Appendix B.1, we show that tcatch ~ tM where
 (12)
(12)
which is the timescale over which the integrated thrust of the nova wind matches the momentum of the ejecta, as could be expected by inspecting the equation of motion (Eq. (8)).
2.4 Interaction with the external medium
We have neglected the interaction of the ejecta with the surrounding external medium. For the interstellar medium, the swept-up material is indeed negligible until the transition to the Sedov-Taylor regime at
 (13)
(13)
which is much longer than the timescales under consideration here.
3 Modeling of particle acceleration and radiation
3.1 Particle acceleration
Particle acceleration at the shocks is computed separately from the hydrodynamics, in the test particle approximation, that is, assuming no retroaction of the acceleration process on the dynamics of the shocks. We used the two-zone model introduced in Martin & Dubus (2013), which works as follows: a small fraction of particles entering the shock undergo diffusive shock acceleration (DSA) in a layer at the shock front, the acceleration region, and their evolution depends on a competition between inflow of material into the shock, advection away from it, energy gain through DSA, and energy loss mostly from radiative processes; at any time, an energy-dependent fraction of particles in the acceleration region are advected downstream of the shock, and they accumulate in a layer, the cooling region, where they can only lose energy and radiate.
In each zone, particle distributions are computed over time by solving a transport equation in momentum space, using as input the shock trajectory (position and velocity) and environmental conditions (upstream gas density and velocity, radiation field density) computed from the equations given in Sect. 2.3. Namely, the evolution of the non-thermal particle distribution N(p) in each zone is computed through the following general equation (with subscripts A or B for the acceleration zone and cooling zone, respectively):
 (14)
(14)
where ṗ is the momentum gain/loss rate, τ the characteristic escape time, and Q the source term. In the acceleration zone, these quantities have the following expressions:
 (15) (16) (17)
where mp and μ are the proton mass and the mean molecular mass, respectively, q is the shock compression ratio, and MX,s = Mej,s or Mw,s and V X,s = (vs − v) or (vw − vs) depending on whether we are treating the forward or reverse shock. The escape time is computed as the ratio of the average cycle time by the escape probability, and involves the Bohm diffusion coefficient DB (p). The source term is a Dirac at the momentum pinj and its amplitude is controlled by the injection fraction ηinj. In the cooling zone, the terms in the transport equation are:
 (18) (19) (20)
The source term is now the escape from zone A and there is no acceleration.
Both zones are treated in the thin shell approximation and are characterized at each time by a single set of hydrodynamical quantities. In particular, the code is not suited to track the downstream evolution of non-thermal particles in a spatially resolved way, with particles of different ages experiencing different physical conditions. Instead, all particles advected downstream up to a given time are assumed to experience the same physical conditions at that time.
In the equations above, the following hypotheses were made: (1) A fraction ηinj = 10−4 of the particles crossing the shock front enter the acceleration process, and they do so with a fixed momentum pinj = 1 MeV c−1 , irrespective of the conditions at the shock; in the comparison to the Fermi-LAT observations, the predicted spectra and light curves will be rescaled by a renormalization factor that is related linearly to the particle injection fraction. (2) The electron-to-proton ratio at injection is set at 10−2; as will be illustrated further down, the gamma-ray emission is largely dominated by hadronic interactions and the exact value of the electron-to-proton ratio therefore is irrelevant in that context; it is more important in the discussion of the synchrotron emission at radio wavelengths or bremsstrahlung emission in hard X-rays. (3) The spatial diffusion of non-thermal particles back and forth across the shock occurs in the Bohm limit, where the particle scatter with a mean free path that is equal to the gyroradius and at a rate that depends on the total amplified magnetic field; hybrid simulations of ion acceleration in non-relativistic shocks showed that this is the case for shocks with Mach number  (Caprioli & Spitkovsky 2014). With the parameters we considered for the ejecta and wind properties, this condition is always satisfied at the reverse shock, which, as we will see, dominates the gamma-ray emission. At the forward shock, however,
  is closer to 20 and only reaches above 30 for light ejecta and strong winds. (4) The magnetic field is amplified by particles streaming ahead of the shock, up to a strength that corresponds to a magnetic energy density of 1% of the upstream kinetic energy density (the typical value inferred for shell-type supernova remnants, see Völk et al. 2005). We investigated the effect of higher conversion efficiencies, up to 5%, and found it to be minor.
As noted in Sect. 2.2, ejecta densities in the first days to weeks after eruption are such that shock-heated material will cool very rapidly compared to the dynamical time scale of the double-shock system. Cooling is actually so efficient that the characteristic length of the radiative relaxation layer downstream of the shock can be comparable to the characteristic diffusion length of particles being accelerated. This could affect particle shock acceleration in two ways: first, the cooled medium may become neutral and strongly damp the magnetic turbulence needed for high-energy particle scattering; second, the strong compression in the radiative relaxation layer would dramatically increase energy losses for the highest-energy particles that propagate downstream into the cooled shocked gas layer. We implemented an exponential cutoff at particle momentum pm ax to ensure that, at any time, the size of the acceleration region downstream is lower than the characteristic size of radiative relaxation layer, or
 (21)
(21)
where ne, ni , Td , and vd are the electron density, ion density, temperature, and flow velocity immediately downstream of the shock, DB (pmax) is the Bohm diffusion coefficient at the maximum particle momentum, and Λ is the temperature-dependent cooling function. By default, we used the cooling function of Schure et al. (2009) that includes thermal bremsstrahlung and atomic line transitions for a solar metallicity plasma (but see the discussion in Sect. 3.3). For the typical internal shock parameters explored here, the implications of this effect on the forward andreverse shocks are very different: at the latter, the maximum particle energy is reduced by a factor ≲2 over the first days2 , whereas at the former it is reduced by afactor ≳10 over the first weeks. This is due to the ~10 times higher upstream densities and ~10 times lower flow velocities at the forward shock, which makes it much more efficiently radiative and for a longer time than the reverse shock. Overall, the contribution of the forward shock to the gamma-ray emission is subdominant over most of the parameter space we explored, even without the above quenching of the particle acceleration, and we restrict ourselves to the contributionof the reverse shock in the following. Only in the case of light ejecta and powerful wind will the forward shock have a comparable contribution to the emission, because this leads to higher velocity and mass inflow at the forward shock, and exactly the oppositeat the reverse shock. Such parameters are, however, not favored by the current observations (see Sect. 4.3).
3.2 Gamma-ray emission from accelerated particles
From the particle distributions thus obtained, gamma-ray emission is computed as a function of time. The emission is largely dominated by the population of particles accumulated in the cooling region downstream of the shock. Protons and electrons radiate via neutral pion production and bremsstrahlung in the downstream gas, respectively, the density of which will increase rapidly because of the radiative nature of the shocks. As already mentioned, our code does not allow to follow the downstreamevolution of accelerated particles as they move away from the shock and experience increasing densities. Instead, a single density is adopted at each time, and we discuss in the following section our assumption on this point.
In addition to the gas-related processes mentioned above, electrons will also radiate through inverse-Compton scattering, predominantly with the nova light because the companion star is several orders of magnitude dimmer than the nova. The radiation density at any position was computed assuming a constant luminosity of 1038 erg s−1 and an effective temperature of 104 K (these are typical values for the early fireball stage, see Skopal et al. 2014, for the case of V339 Del). The evolution of the nova light over the course of weeks would affect inverse-Compton losses and the corresponding emission spectrum, but we neglected it because inverse-Compton scattering was found to be a minor contribution to the gamma-ray output of the nova (in the context of internal shocks). We also found that secondary electrons and positrons from charged pions produced in hadronic interactions have a negligible contribution at gamma-ray energies ≥100 MeV. Secondary leptons have an energy distribution comparable to that of gamma-rays from neutral pions, but most of this energy is used up in synchrotron losses. We therefore neglected the contribution of secondary leptons in the present context, focused on high-energy gamma-rays, but their contribution will be relevant in the soft gamma-ray/hard X-ray range (Vurm & Metzger 2018).
Given the very high gas densities at stake in the ejecta, especially in the first days after the nova eruption ( >1010−11 cm−3), gamma-ray absorption from interactions with matter cannot be neglected. We implemented the absorption of gamma rays by interaction with nuclei using the cross-section formulae in Schlickeiser (2002), and the attenuation from Compton scattering using the cross-section formulae in Rybicki & Lightman (1986), under the approximation of a simple exponential attenuation. The effects are weak except over the first few days and for the most massive ejecta with Mej ≥ a few 10−4 M⊙. We neglected the opacity from gamma-gamma interactions because, at the maximum gamma-ray energies observed, ~10 GeV, pair creation requires target photons with energies in the soft X-ray range, which is much more than those produced by a nova over the first few weeks, even in the nebular phase.
3.3 On downstream density
In the isothermal limit, gas can be compressed by up to a factor  in radiative shocks, or about ~104 for the typical conditions we consider here. Yet, such high densities may not be reached because magnetic field and non-thermal particles may limit gas compressibility to more modest values of ~102. Even in the latter case, such high compression factors may have a major influence on the non-thermal energy that can be extracted and turned into radiation.
Depending on the actual thermal cooling rate (whether or not line cooling contributes and to what extent, depending on the ionization state and chemical composition of the plasma), the timescale for thermal cooling of the ~107−8 K shocked gasis comparable to or lower than the timescale for hadronic interactions (tπ ≃ 1015 s∕n, where n is the gas number density in cm−3). Over the thermal cooling time scale, relativistic particles advected away from the shock will gain energy by afactor of a few as a result of adiabatic heating (the energy gain is proportional to n1∕3 ). A proper treatment of non-thermal particle evolution downstream thus requires solving for the structure of the cooling layer. This was examined in Vurm & Metzger (2018), who computed the downstream evolution of the thermal, non-thermal, and magnetic pressure components, but this is beyond the capabilities of our code. Yet, for the densities at stake in our nova internal shock scenario, immediate downstream densities of ~1011−14 cm−3 over the first 10 days, the timescale for hadronic interactions is of the order of minutes to hours; over a day, the typical timescale on which wewant to predict gamma-ray emission properties, non-thermal protons therefore radiate most of their energy away, whatever the cooling layer structure.
In the framework of our code, we neglected the energy gained by particles as a result of adiabatic compression and adopted a density in the cooling region that is ten times the immediate post-shock density; this provides a good approximation of proton energy losses over the first 2–3 weeks while avoiding the very small time steps that would be required by much larger densities and very short cooling time scales. Beyond approximately 20 days, we underestimate the energy lost by protons in pion production. On the other hand, the radiative efficiency of the shocks diminishes with time because upstream densities decrease rapidly; for our reference set of parameters, the reverse shock transitions from radiative to adiabatic over the first few weeks, so our assumption of a modest compression factor may not be so inappropriate at such late times. In Fig. 2, we show the gamma-ray light curves obtained for various compression factors from 1 to 1000. The deviations are negligible over the first 10 days, and using a factor of 10 instead of a larger value introduces a downward bias of the order of 20% after 20 days. We also tested the case of cooling in the average shell density, computed from the shell swept-up mass, radius, and thickness (see Sect. 2.2), and it gives comparable results.
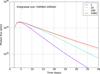 |
Fig. 2 Photon light curves for four values of the gas compression factor in the cooling zone. The vertical dashed line marks the onset of the wind. |
4 Predicted spectra and light curves
4.1 Grid of models
The main ingredients of the simulations consist in: an ejecta with mass Mej , a power-law density profile with exponent nej, homologous expansion with maximum velocity vej and minimum velocity vin; and a wind starting at time tw after the eruption, with a constant velocity vw, and an exponentially decreasing mass-loss rate Ṁw with characteristic time Dw. We assessed how parameters of the internal shock scenario affect the gamma-ray output and considered the ranges of values listed in Table 1. The complete grid of models consists in 2700 runs. Our reference set of parameters is (Mej, vej, vin, Ṁw, vw, Dw, tw) = (10−4, 1000, 10, 10−3, 2000, 10, 2), with the units given in Table 1; below we discuss variations from that reference case. A power-law radial density profile with index nej = 2 was assumed for the ejecta in all runs.
Ejecta and wind parameters considered in the simulations.
4.2 Properties of the gamma-ray emission
The principal features of the gamma-ray emission and their dependence on model parameters were assessed from the grid of models defined above.
Emission site. As already mentioned, the emission is dominated by the reverse shock, by more than one order of magnitude over most ofthe parameter space. The reverse shock is able to accelerate particles up to higher energies, as could be expected from the discussion in Sect. 2.2: the upstream flow velocity in the shock frame is much higher at the reverse shock than at the forward shock, which means particle acceleration up to higher energies because of the velocity-squared dependence of the energy gain rate through DSA (and the fact that magnetic fields are of comparable amplitude at the forward and reverse shocks).
Emission process. The emission above 100 MeV is dominated by pion decay. The strong inverse-Compton and synchrotron energy losses severely deplete the population of electrons and cause their spectral energy distribution to reach a maximum at a few 100 MeV and to decrease steeply beyond that energy. As a consequence, pion decay completely dominates the gamma-ray spectrum, except in the 1–20 MeV range, where bremsstrahlung takes over.
Emission level. The total luminosity is primarily set by the wind mass-loss rate. This is illustrated in Fig. 3, for four values of Ṁw from 10−4 to 3 × 10⁻³ M⊙ yr−1. The photon luminosity scales almost linearly with Ṁw. The latter parameter sets the rate at which particles enter the acceleration process, hence the total number of non-thermalparticles radiating after a given amount of time (all other things being equal, especially the injection rate).
Emission temporal profile. The light curve profile is mostly driven by the wind properties. The emission rises after a time tw , the delay between the start of the nova eruption and the onset of the nova wind. Once started, the emission reaches a peak within days, up to about a week for the most massive ejecta >10−4 M⊙ because it takes more time for the double shock system to move out and so gamma-ray opacity in the dense layers above the shock system prevents the radiation from escaping over a longer period. Beyond maximum, the emission decrease reflects mostly the time evolution of the wind mass-loss rate, as shown in Fig. 4 for four values of Dw : 5, 10, and 20 days, and an infinite value to illustrate the case of a steady wind. In theory, gamma-ray light curves could thus be a direct probeof this wind component of nova eruptions. In practice, however, as illustrated in Sect. 4.3, current uncertainties on the measurements are still too large to be constraining.
Emission spectral profile. The spectrum of the emission is driven by the upstream flow velocity at the reverse shock. Because of the velocity-squared dependence of the energy gain rate through DSA, this has a strong impact on the maximum particle (hence gamma-ray) energies that can be reached. The parameter of prime importance is the wind velocity vw , but other parameters affecting the dynamics of the double shock system, such as Ṁ w and Mej , will also have some influence on the gamma-ray spectrum. High values for vw and Ṁ w and low values for Mej will allow the shock system to move away from the WD more rapidly, and thus reduce the upstream flow velocity in the reverse shock frame. In contrast, vej and vi n have a negligible influence on the spectrum. The effects of vw and Mej are illustrated in Figs. 5 and 6, while the effect of Ṁ w was presented in Fig. 3. Wind velocities ≥3000 km s−1 result in gamma-ray emissions reaching more than 100 GeV but, as we see below, such high velocities are not favored by the current Fermi-LAT observations.
The parameters discussed above are those with the most noticeable impact on the predicted gamma-ray signal. We assessed the effects of several other quantities or assumptions and found differences of the order of ≲10% over the first two weeks after nova eruption, which would thus be undetectable given the uncertainties in the Fermi-LAT observations. In particular, we tested values from 0 to 2 for the density index nej ; lower valuesresult in a slightly flatter light curve and a spectrum reaching slightly lower energies, because the lower densities in the inner ejecta allow the shock system to move out more rapidly (hence lower upstream flow velocities in the reverse shock frame) and travel across denser material at late times (hence more particles being accelerated). We also compared the cases of continuum cooling and line cooling for the cooling function Λ that sets the sizeof the radiative relaxation layer (see Eq. (21); we refer the reader to Metzger et al. 2014 for a discussionon the uncertain ionization state of the cooling plasma in the presence of potentially strong photo-ionization); the more efficient line cooling results in a spectrum reaching slightly lower energies, because the smaller radiative relaxation layer imposes a smaller acceleration region, hence lower maximum particle energies pmax, but the difference remains limited to a factor of a few because the criterion of Eq. (21) is naturally fulfilled after about a week for most conditions, allowing pmax to increase unconstrained afterwards.
We also evaluated the impact of a departure from spherical symmetry such as in the case of, for example, ejecta with different masses and velocities in the equatorial plane and polar directions (as inferred for V959 Mon, see Chomiuk et al. 2014). We mimicked this scenarioby a simple linear combination of two runs. We assumed that half of the solid angle consists in heavy and slow ejecta with (Mej, vej) = (3 × 10⁻⁴, 1000), while the other half consists in light and fast ejecta with (Mej, vej) = (10−5, 3000) (we neglect interactions at the boundaries between the two regions); both components are then hit by a wind starting 2 days after the eruption, with velocity 2000 km s−1 and mass-loss rate 10−4 M⊙ yr−1. The light curve thus obtained is plotted in Fig. 7. Combining the components results in some flattening of the light curve, and the plot suggests that multiple peaks may be produced for specific combinations of parameters. This could explain the double peak in the light curve of the bright nova ASASSN-16ma detected by the LAT last year (Li et al. 2016).
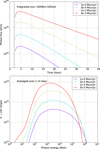 |
Fig. 3 Photon light curves and averaged spectra for four values of the wind mass-loss rate Ṁ w from 10−4 to 3 × 10⁻³ M⊙ yr−1. The verticaldashed line marks the onset of the wind. |
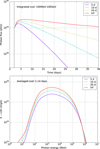 |
Fig. 4 Photon light curves and averaged spectra for four values of the wind characteristic duration Dw of 5, 10, and 20 days and an infinite value to illustrate the case of a constant wind mass-loss rate. The vertical dashed line marks the onset of the wind. |
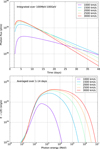 |
Fig. 5 Photon light curves and averaged spectra for five values of the wind velocity vw from 1000 and 3000 km s−1. The verticaldashed line marks the onset of the wind. |
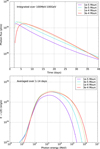 |
Fig. 6 Photon light curves and averaged spectra for four values of the ejecta mass Mej from 10−5 and 3 ×10⁻⁴ M⊙. The verticaldashed line marks the onset of the wind. |
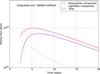 |
Fig. 7 Photon light curves for a non-spherical case, with heavy and slow ejecta in the equatorial plane and light and fast ejecta in thepolar directions (obtained by linearly combining two runs and neglecting interactions at the boundaries; see text). |
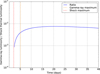 |
Fig. 8 Ratio of the gamma-ray luminosity to the reverse shock thermal power as a function of time, for a model with parameters (Mej, vej, vin, Ṁw, vw, Dw, tw) = (10−4, 1000, 10, 3 × 10⁻³, 2000, 10, 2) and a protoninjection fraction of 4 × 10⁻⁵. The red and orange vertical dashed lines mark the peak of the shock thermal power and gamma-ray luminosity, respectively. |
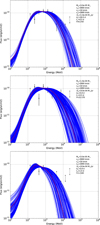 |
Fig. 9 Model spectra fitted to Fermi-LAT observations for V407 Cyg, V1324 Sco, and V959 Mon (from top to bottom). The red solid curve corresponds to the best-fit model, whose parameters are listed in the top-right corner (f being the renormalization factor). The blue dotted curves correspond to model fits that are in the 68.3% confidence interval. |
4.3 Comparison to Fermi-LAT observations
We havecompared the Fermi-LAT observed spectra and light curves for the six novae presented in Ackermann et al. (2014) and Cheung et al. (2016b) to our grid of 2700 models. For each model, an averaged spectrum and a photon light curve were jointly fitted to the data using a χ2 criterion. The only fit parameter is a renormalization factor f. This factor f is related linearly to the particle injection fraction and can therefore be interpreted as a correction to the initially assumed value of 10−4 (see Sect. 3.1). For each nova, we identify the best-fit set of parameters as well as a 1σ uncertainty domain. The latter is defined as the ensemble of model fits that are in the 68.3% confidence interval, that is, fits yielding  for 7 degrees of freedom, where
  is the best-fit criterion3. We excluded from this range all models that, after renormalization, yielded non-thermal efficiencies >10%, to be consistent with our initial test particle approximation (see Sect. 3.1; in practice, only a small number of fits were filteredout by this criterion).
The distances assumed for the novae and the fit results are summarized in Table 2. Spectra and light curves of all models in the 68.3% confidence interval are overplotted to the Fermi-LAT data points and upper limits in Figs. 9 to 12, with the best-fit profiles marked as bold red lines. In the light curves, the Fermi-LAT data points were scaled down compared to the plots published in Ackermann et al. (2014) and Cheung et al. (2016b). The original data points were computed under the assumption of a power-law spectrum with fixed index 2.2 or 2.3 over time, which biases the comparison with the strongly curved spectra from our model. We have therefore rescaled the data points by the ratio of integrated photon fluxes from the best-fit exponentially cutoff power-law and simple power-law models provided in Ackermann et al. (2014) and Cheung et al. (2016b) (which results in corrections by factors of ~0.7–0.9).
The best fits obtained are quite satisfactory, with reduced χ2 below 1 for all six novae. The renormalization factors f are all of order unity, except for V1324 Sco, which is the most distant and most luminous one in gamma rays, and thus requires a larger population of non-thermal particles. The observed averaged spectra are well reproduced, both regarding data points around 1 GeV and upper limits at ~0.1 and ~10 GeV. Fits to the light curves are also satisfactory, although one can note that the model tends to slightly underestimate the flux level between day ~5 and ~10. This is a consequence of the time profile assumed for the wind mass-loss rate: in the absence of solid constraints, we considered an exponential decrease but the comparison to the data suggests that a plateau phase lasting about a week and followed by a decrease would have provided a slightly better fit.
Figures 9 to 12 reveal that a large number of models can account for the data, which stems mostly from large uncertainties in the measurements. Figure 13 shows for all novae the distribution of fit parameters for all models that are in the 68.3% confidence interval, and this illustrates how poorly constrained most parameters are. The bottom panel shows that almost the full range of explored values for Mej is likely, with only too massive ejecta >10−4 M⊙ being disfavored for half of the novae. Similarly, the middle panel illustrates that most tested values for Ṁ w are likely, although most fits seem to favor Ṁw ≤ 10−3 M⊙ yr−1 . The latter plot also shows two effects: firstly, there is a degeneracy between the wind mass-loss rate and the renormalization factor f, such that a stronger wind mass-loss rate is compensated by a lower injection fraction; secondly, the renormalization factor is correlated to the distance, with the highest values being obtained for the most distant nova, V1324 Sco, and the lowest values for the closest objects, V5668 Sgr and V959 Mon. The only parameter that seems to be rather well constrained is vw , whose best-fit values seem to be quite uniform among all six novae (which could have been expected because of the similarity of spectra and the discussion in Sect. 4.2). The top panel of Fig. 13 shows that the current observations of gamma-ray emitting novae favor wind velocities <2000 km s−1. The need for relatively low wind velocities is strengthened by the fact that we neglected adiabatic heating downstream, which would tend to shift particle distributions to higher energies by a factor ≲5.
In terms of energetics, Fig. 14 illustrates that the gamma-ray output can vary by up to two orders of magnitude from one nova to another (assuming distance estimates are correct). Unfortunately, the large uncertainties in the gamma-ray measurements do not allow to strongly constrain the total kinetic energy released in the eruption. For each nova studied here, a given level of energy emitted in gamma-rays can be reproduced from widely different wind or ejecta energies, spanning two orders of magnitude or more. As a consequence, the efficiency of particle acceleration and gamma-ray production by novae cannot be strongly constrained from gamma-ray observations alone.
Overall,gamma-ray observations of all six novae can be accounted for by about the same scenario: an ejecta of mass 10−5–10−4 M⊙ expands with a velocity 1000–2000 km s−1, followed within a day by a wind with mass-loss rate 10−4–10−3 M⊙ yr−1 and velocity 1000 km s−1 and declining over a time scale of a few days; a fraction 10−4 of protons entering the reverse shock front are accelerated, diffusing across the shock in the Bohm limit, in a magnetic field with an energy density of 1% of the upstream kinetic energy density, eventually reaching energies of about 100 GeV and radiating from hadronic interactions in the dense downstream medium. Variations by factors of a few in ejecta mass and wind mass-loss rate from nova to nova result in gamma-ray luminosities spanning at least an order of magnitude in gamma-ray luminosity, which allows us to detect objects over a relatively wide range of distances.
Novae assumed distances and best-fit eruption parameters.
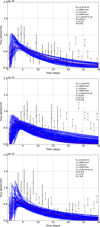 |
Fig. 10 Model light curves fitted to Fermi-LAT observations for V407 Cyg, V1324 Sco, and V959 Mon (from top to bottom). The red solid curve corresponds to the best-fit model, whose parameters are listed in the top-right corner (f being the renormalization factor). The blue dotted curves correspond to model fits that are in the 68.3% confidence interval. |
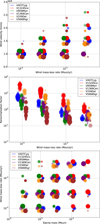 |
Fig. 13 Distribution of fit parameters for all models that are in the 68.3% confidence interval. Each dot corresponds to a fitted model and has a size that is inversely proportional to the reduced χ2 and a color that indicates the nova observation to which it was fitted (several dots are superimposed for most parameter combinations). Dots for the different novae are slightly offset horizontally and vertically from the exact parameter values for readability. |
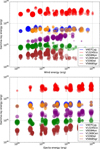 |
Fig. 14 Energy emitted in gamma-rays over the first 40 days as a function of the total wind energy (top panel) and ejecta energy (bottom panel), for all models that are in the 68.3% confidence interval. Each dot corresponds to a fitted model and has a size that is inversely proportional to the reduced χ2 and a color that indicates the nova observation to which it was fitted. |
4.4 V407Cyg: internal or external shocks?
Interestingly, this internal shock model seems to account reasonably well for the gamma-ray observations of V407 Cyg, which is not a classical nova but a nova in a symbiotic system. This calls into question the actual contribution of an external shock to the emission from such systems. In the model for V407 Cyg presented in Martin & Dubus (2013), it was shown that an external shock propagating in a wind density profile cannot reproduce the observed light curve. Instead, it was proposed that matter accumulation in the orbital plane and around the white dwarf, as obtained in hydrodynamical simulations of the quiescent accretion phase, is required to get an early rise and rapid drop of the gamma-ray emission. The internal shock scenario explored here does not exclude an additional contribution from an external shock, but it certainly alleviates the constraints of early rise and rapid drop of the light curve. On the other hand, the rapid decline in the optical light curve and the early appearance of coronal lines and soft X-ray emission from the WD favor a low ejecta mass of ~10−7–10−6 M⊙ (see Chomiuk et al. 2012, and references therein), which seems to contradict the best-fit ejecta masses of ~10−5–10−4 M⊙ obtained here for V407 Cyg (see Fig. 13).
4.5 Prospects at other wavelengths
X-ray emission from the shocked material would most likely be a critical probe of the properties of the wind and ejecta. However, the X-ray emission from the shocked plasma may be absorbed and reprocessed to optical wavelengths, as pointed out in Metzger et al. (2014). The top panel of Fig. 15 shows the peak thermal power, that is the maximum rate of conversion of mechanical energy into thermal energy at the reverse shock, corresponding to the best-fit model parameters obtained forthe six novae (computed using Eq. (28) from Metzger et al. 2014, for the radiative shock case). The shock-related thermal power varies by two orders of magnitude over the parameter space constrained by the gamma-ray observations, and this will most likely have observational consequences. In particular, thermal powers much in excess of 1038 erg s−1, which is thetypical (Eddington) luminosity of a nova, are probably excluded in most cases because they would give rise to over-luminous novae either in X-rays or in optical. This sets constraints on the wind energetics and would disfavor large wind velocities and combinations of large ejecta masses and large wind mass-loss rates. Conversely, our model shows that gamma-ray observations can be reproduced from low ejecta masses ~10−5 M⊙, low wind mass-loss rates ~10−4 M⊙ yr−1 and velocities ~1000 km s−1, which would produce shock-related thermal emission about an order of magnitude below the canonical 1038 erg s−1. In either case, the velocities of the different ejecta/outflow components may be probed from the profile and evolution of emission lines (Cassatella et al. 2004).
Li et al. (2017) recently presented a convincing case of correlation between optical and gamma-ray emission from ASASSN-16ma, a nova with super-Eddington luminosity, thus lending support to the scenario put forward by Metzger et al. (2014). Li et al. (2017) observed a nearly constant gamma-ray-to-optical flux ratio over 10 days past gamma-ray maximum and we compared their observations to a selected model of our grid. Using (Mej, vej, vin, Ṁw, vw, Dw, tw) = (10−4, 1000, 10, 3 × 10⁻³, 2000, 10, 2) and a proton injection fraction of 4 × 10⁻⁵, our model yields shock and gamma-ray luminosities with maximum values of 1039 and 2 × 1036 erg s−1, respectively, which translates into fluxes of 5 × 10⁻⁷ and 9 × 10⁻¹⁰ erg s−1 cm−2 (assuming a distance of 4.2 kpc, as used in Li et al. 2017). This is in very good agreement with the measured peak optical flux, expected to approximately trace the total shock power in the scenario of Metzger et al. (2014), and with the peak gamma-ray flux measured with the Fermi-LAT. Also consistent with the observations, the model predicts a ratio of the gamma-ray luminosity to the shock thermal power that is nearly constant after the gamma-ray maximum (see Fig. 8; the ratio varies by less than a factor of 2 over a few weeks). The predicted ratio is, however, a factor of ~2 above the observed value, a discrepancy that may be solved by adopting for instance a slightly different density profile for the ejecta or a different time evolution for the wind properties.
Radio emission is also a powerful diagnostic of the mass and dynamics of the material ejected by a nova. In the classical picture, the expanding ejected envelope is photoionized and heated to a temperature of ~1–4 × 10⁴ K by radiation from stable burning of the remaining hydrogen at the surface of the WD (Cunningham et al. 2015); this gives rise to thermal bremsstrahlung emission that is routinely detected at frequencies of ~1–10 GHz up to years after the eruption. This emission has characteristic light curves and spectra, resulting from the frequency-dependent transition from optically thick to optically thin radiation, and these can be used to estimate the mass, density, and velocity structures of the envelope. The bottom panel of Fig. 15 shows the peak thermal emission at 5GHz corresponding to the best-fit model parameters obtained for the six novae (Bode & Evans 2008, assuming homologous expansion of a fully ionized hydrogen envelope at 10 000 K). The peak radio luminosity varies by nearly two orders of magnitude over the parameter space constrained by the gamma-ray observations, and this illustrates how combining radio and gamma-ray observations can reduce uncertainties on the parameters of the internal shock scenario. Using a similar model for the thermal emission, Finzell et al. (2018) derived a mass of 2.0 ± 0.4 × 10⁻⁵ M⊙ and velocity of 1150 ± 40 km s−1 for the ejecta of V1324 Sco, in agreement with our best-fit values for the gamma-ray emission model.
We emphasize, however, that the radio luminosities presented in Fig. 15 do not take into account the effects of the nova wind. In the internal shock scenario, the dense cooled shell comprised between the forward and reverse shocks will shield the unshocked ejecta against ionization by the WD, at least for some time, thus affecting the ionization structure of the ejecta and potentially its thermal emission. This will also have an impact on the escape or not of synchrotron emission, another probe of the non-thermalphenomena, possibly detected in several systems (Weston et al. 2016b,a; Vlasov et al. 2016). We will address these points elsewhere, but our first results show that the late thermal radio emission eventually scales with the mass of the envelope and reaches peak levels comparable to those obtained for a simple expanding envelope.
Last, the comparison of our model predictions to the Fermi-LAT observations suggests that prospects for detecting novae at very high ~TeV energies are currently rather limited if the six objects studied here provide a representative view on high-energy phenomena in novae. Existing Imaging Atmospheric Cherenkov Telescopes probably have energy thresholds that are too high and sensitivities that are too low to detect the high end of a nova spectrum (Aliu et al. 2012; Ahnen et al. 2015). The next-generation Cherenkov Telescope Array very-high-energy observatory might be able to detect >100 GeV signals from novae if some of them can produce powerful high-velocity winds combined with a massive enough ejecta in order to generate a fast reverse shock. As described above, such conditions would most likely result in highly luminous early thermal emission, therefore targeting abnormally bright objects in optical or X-rays might be a good strategy to achieve very-high-energy detections of novae.
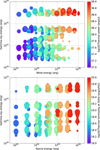 |
Fig. 15 Top panel: same as the top panel of Fig. 14, except that the color indicates the peak thermal power dissipated at the reverse shock. Bottom panel: same as the bottom panel of Fig. 14, except that the color indicates the peak thermal luminosity at 5GHz produced by the expanding ionized ejecta (undisturbed by internal shocks; see Sect. 4.5). |
5 Conclusions
Numerical simulations of novae suggest that the sequence of mass ejection during an eruption may involve the slow expansion of an envelope followed by the launch of a faster wind. The interaction of both components would lead to the formation ofa forward and reverse shock system, as supported by observational evidence in the radio, optical, and X-ray domains. Given the densities and velocities at stake, those shocks are expected to be strongly radiative over the first weeks, which would influence the bolometric luminosity of the nova, and to produce non-thermal emission, which could account for the gamma-ray emission detected from a handful of novae with the Fermi-LAT instrument.
We present a model for particle acceleration and gamma-ray emission at internal shocks in novae. The dynamics of the radiative shock system in the nova ejecta is solved from the equation for momentum conservation, assuming spherical symmetry and neglecting effects of the companion star or interactions of the ejecta with pre-existing circumbinary material. From the resulting hydrodynamical quantities, particle acceleration is computed in the test particle approximation and assuming Bohm diffusion by solving a time-dependent transport equation for particle injection, acceleration, losses, and escape.
For typical parameters, the ≥100 MeV gamma-ray emission arises predominantly from particles accelerated at the reverse shock and undergoing hadronic interactions in the dense cooling layer downstream of the shock. The maximum gamma-ray energy is driven by the wind velocity, while the wind mass-loss rate sets the gamma-ray luminosity. The emission rises within days after the onset of the wind, quickly reaches a maximum, and its subsequent decrease reflects mostly the time evolution of the wind properties. Departure from spherical symmetry, such as ejecta with different masses and velocities in the equatorial plane and polar directions, results in a flattening of the light curve and possibly in multiple peaks.
We fitted our model to the spectra and light curves measured with the Fermi-LAT for six novae (V407 Cyg, V1324 Sco, V959 Mon, V339 Del, V1369 Cen, and V5668 Sgr), testing more than 2000 combinations of the ejecta and wind parameters. Because of the large uncertainties in the measurements, a large array of parameter values are able to reproduce the observations. The strongest constraints are obtained for the wind velocities, with values ≲2000 km s−1 favored by the observed spectra. A typical model for all six novae is the following: an ejecta mass in the range 10−5–10−4 M⊙ expands with a velocity 1000–2000 km s−1, followed within a day by a wind with a mass-loss rate of 10−4–10−3 M⊙ yr−1 and a velocity ≲2000 km s−1 and declining over a time scale of a few days; a fraction of approximately 10−4 of the protons entering the reverse shock front are accelerated up to energies of about 100 GeV and efficiently radiate from hadronic interactions. This typical model is able to account within a factor of 2 for the main features in the observations of the brightest nova ever detected in gamma-rays, ASASSN-16ma.
Gamma-ray observations hold potential for probing the mechanism of mass ejection in novae. A more comprehensive test of the internal shock hypothesis and tighter constraints on the parameters should be provided by modeling the associated thermal emissions, notably in radio and X-rays, and by clarifying whether synchrotron emission is expected. Radiation hydrodynamics calculations would certainly be useful to determine the ionization structure of the ejecta and compute in particular the reprocessingof X-rays and the opacity to optical and radio radiation.
Acknowledgements
We gratefully acknowledge use of the PLUTO code distributed at http://plutocode.ph.unito.it/. The authors acknowledge support from the Programme National Hautes Energies and from the Centre National d’Etudes Spatiales. PM and GD thank Brian Metzger for useful discussions on the subject, especially during the “International Workshop on Shocks and Particle Acceleration in Novae and Supernovae” he organized in New York City in 2016.
Appendix A Adiabatic case
A.1 Shock propagation
We detail here the case of an adiabatic interaction of the nova wind with the ejecta. The nova wind adds energy in the shocked wind region at a rate
![Mathematical equation: \begin{equation*} \fd{E}{t}=\fd{}{t}\left[ \frac{4}{3}\pi r_{\textrm{s}}^3 \frac{P}{(\gamma-1)} \right]=\frac{1}{2}\dot{M}_{\textrm{w}}v_{\textrm{w}}^2-4\pi r_{\textrm{s}}^2v_{\textrm{s}}P,\end{equation*}](/articles/aa/full_html/2018/04/aa31692-17/aa31692-17-eq25.png) (A.1)
(A.1)
where γ is the adiabatic index of the gas. The pressure from the shocked wind then drives the shell of swept-up ejecta, assumed to be squeezed in a thin shell between the shocked wind and unshocked ejecta:
![Mathematical equation: \begin{equation*} \fd{}{t}\left[M_{\textrm{ej, s}}v_{\textrm{s}}\right]-\dot{M}_{\textrm{ej,s}}v=4\pi r_{\textrm{s}}^2 P .\end{equation*}](/articles/aa/full_html/2018/04/aa31692-17/aa31692-17-eq26.png) (A.2)
(A.2)
These equations are similar to those describing the evolution of a wind in an external medium (Castor et al. 1975). They allow for a self-similar solution with P ∝ tβ and rs ∝ tα. Equation (A.1) imposes β = 1 − 3α. The solution, assuming nej ≤ 3, is
 (A.3) (A.4)
with the constants
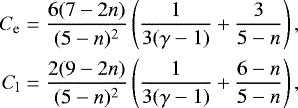 (A.5) (A.6)
and with
 (A.7)
(A.7)
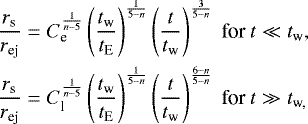
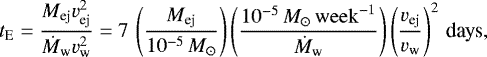
which is the timescale over which the integrated kinetic power of the nova wind matches the kinetic energy of the ejecta. We focus on the limiting case t ≫ tw (Eq. (A.4)) as the more relevant one since we identify tw with the delay between the initial ejection of material and the onset of the wind outflow. The shock has propagated throughout the ejecta when rs = vejt, hence the time for the shock to catchup with the leading edge of the ejecta is
 (A.8)
(A.8)
showing that the nova wind propagates adiabatically through the ejecta on the energy injection timescale tE . The constant Cl is ≈1.22 for nej = 0 and Cl ≈ 2.04 for nej = 2 (with γ = 5∕3).
A.2:
Radiative losses
Using Eq. (A.4) to calculate vs, the Mach number of the shock for t ≫ tw is roughly
![Mathematical equation: \begin{equation*} {\cal M}_{\textrm{fs}}= \frac{v_{\textrm{s}}-v}{c_{\textrm{s}}}\approx \left(\frac{v_{\textrm{ej}}}{c_{\textrm{s}}}\right)\left(\frac{C_{\textrm{l}}^{\frac{1}{n-5}}}{5-n}\right) \left[\frac{t_{\textrm{energy}}}{t_{\textrm{w}}}\right]^{\frac{1}{n-5}} \left(\frac{t}{t_{\textrm{w}}}\right)^{\frac{1}{5-n}},\end{equation*}](/articles/aa/full_html/2018/04/aa31692-17/aa31692-17-eq31.png) (A.9)
(A.9)
where cs ≪ vej is the sound speed in the ejecta material. The shock is strong so the temperature of the shocked ejecta is
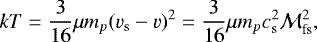 (A.10)
where μ is the mean molecular weight (μ = 0.5 for ionised hydrogen). The cooling timescale of the shocked ejecta is
 (A.11)
with n = ρ∕(μmp being the number density. Λ = Λ0T1∕2 = 2 × 10⁻²⁷T−27 is the cooling function assuming optically thin thermal bremsstrahlung emission. Using Eqs. (A.4), (A.9), and (A.10) and the expression for ρ (Eq. (2)), we find that τcool ≤ t as long as
 (A.12)
which is about 156 days (resp. 42 days) for nej = 0 (resp. nej = 2), tcatch = 7 days, Mej = 10−5 M⊙ and vej = 1000 km s−1. Hence, the cooling timescale is much shorter than the ejecta crossing timescale. The shock into the ejecta is isothermal rather than adiabatic, provided that the radiation escapes.
Comparable conclusions are reached on the reverse shock into the nova wind. Approximating the Mach number of the reverse shock as
 (A.13)
we find that τcool ≤ t for the reverse shock as long as
 (A.14)
which is about 48 days (resp. 35 days) for nej = 0 (resp. nej = 2), tcatch = 7 days, Ṁ w = 10−5 M⊙ week−1, vw = 2000 km s−1 and vej = 1000 km s−1. Again, the cooling timescale is shorter than the ejecta crossing timescale.
Appendix B: Isothermal case
We list here some analytical solutions of use in verifying the numerical integration of the equation of motion (Eq. (8)).
B.1:
Analytical solution for Mej,s ≫ Mw,s
If the mass of the swept-up nova wind material is negligible compared to the swept-up mass of ejecta material then Eq. (8) simplifies to
![Mathematical equation: \begin{equation*} \fd{}{t}\left[M_{\textrm{ej, s}}v_{\textrm{s}}\right]=\dot{M}_{\textrm{ej,s}} v+\dot{M}_{\textrm{w,s}}v_{\textrm{w}}.\end{equation*}](/articles/aa/full_html/2018/04/aa31692-17/aa31692-17-eq37.png) (B.1)
(B.1)
However, we note that the assumption that Mej,s ≫ Mw,s necessarily fails when t≳twind. As for the adiabatic case (Appendix A), power-law solutions of the form rs ∝ tα can be found for Eq. (B.1) provided that vw ≫ vej and nej ≤ 2
 (B.2) (B.3)
where tM defined in Eq. (12). Taking the second case (Eq. (B.3)), the time taken by the shock to cross all the ejecta is
 (B.4)
(B.4)
from which  and
and  . In the isothermal case, the nova wind propagates through the ejecta on the momentum injection timescale tM .
B.2:
Analytical solution for Mej,s = Mej
If the ejecta has been completely swept-up in the shell, that is when t > tcatch, then Eq. (8) simplifies to:
![Mathematical equation: \begin{align*} &\fd{}{t}\left[\left(\dot{M}_{\textrm{w}} \left(t - \frac{r_{\textrm{s}}}{v_{\textrm{w}}}\right)+M_{\textrm{ej}}\right)v_{\textrm{s}}\right]-\dot{M}_{\textrm{w}} v_{\textrm{w}} \left(1-\frac{v_{\textrm{s}}}{v_{\textrm{w}}}\right)=0. \end{align*}](/articles/aa/full_html/2018/04/aa31692-17/aa31692-17-eq42.png) (B.5)
(B.5)
This equation is integrated by changing variable to ![Mathematical equation: $u=\fd{}{t} \left[t-r_{\textrm{s}}/v_{\textrm{w}}\right]$](/articles/aa/full_html/2018/04/aa31692-17/aa31692-17-eq43.png) , giving the result:
, giving the result:
![Mathematical equation: \begin{align*} r_{\textrm{s}}={}&v_{\textrm{w}} (t+t_{\textrm{W}})\nonumber\\ &-v_{\textrm{w}}\left(t_{\textrm{W}}+t_{\textrm{catch}}-\frac{r_{\textrm{catch}}}{v_{\textrm{w}}}\right)\left[1+\frac{2(t-t_{\textrm{catch}})\left(1-\frac{v_{\textrm{catch}}}{v_{\textrm{w}}}\right)}{\left(t_{\textrm{W}}+t_{\textrm{catch}}-\frac{r_{\textrm{catch}}}{v_{\textrm{w}}}\right)}\right]^{1/2}, \end{align*}](/articles/aa/full_html/2018/04/aa31692-17/aa31692-17-eq44.png) (B.6)
(B.6)
where rcatch and vcatch are the radius and the velocity of the shell at t = tcatch, and tW = Mej∕Ṁw. Gorbatskii (1962) found a similar expression but for different initial conditions.
References
- Abdo, A. A., Ackermann, M., Ajello, M., et al. 2010, Science, 329, 817 [NASA ADS] [CrossRef] [PubMed] [Google Scholar]
- Ackermann, M., Ajello, M., Albert, A., et al. 2014, Science, 345, 554 [NASA ADS] [CrossRef] [Google Scholar]
- Ahnen, M. L., Ansoldi, S., Antonelli, L. A., et al. 2015, A&A, 582, A67 [NASA ADS] [CrossRef] [EDP Sciences] [Google Scholar]
- Aliu, E., Archambault, S., Arlen, T., et al. 2012, ApJ, 754, 77 [NASA ADS] [CrossRef] [Google Scholar]
- Banerjee, D. P. K., Srivastava, M. K., Ashok, N. M., & Venkataraman, V. 2016, MNRAS, 455, L109 [NASA ADS] [CrossRef] [Google Scholar]
- Bode, M. F., & Evans, A. 2008, Classical Novae, 2nd edn., Cambridge Astrophysics Series, No. 43 (Cambridge: Cambridge University Press) [CrossRef] [Google Scholar]
- Caprioli, D., & Spitkovsky, A. 2014, ApJ, 794, 47 [NASA ADS] [CrossRef] [Google Scholar]
- Cassatella, A., Lamers, H. J. G. L. M., Rossi, C., Altamore, A., & González-Riestra, R. 2004, A&A, 420, 571 [NASA ADS] [CrossRef] [EDP Sciences] [Google Scholar]
- Castor, J., McCray, R., & Weaver, R. 1975, ApJ, 200, L107 [NASA ADS] [CrossRef] [Google Scholar]
- Cheung, C. C. & Jean, P. (Fermi Large Area Telescope Collaboration) 2015, ATel, 7283 [Google Scholar]
- Cheung, C. C., Jean, P & Shore, S.N. (Fermi Large Area Telescope Collaboration) 2016a, ATel, 9594 [Google Scholar]
- Cheung, C. C., Jean, P., Shore, S. N., et al. 2016b, ApJ, 826, 142 [NASA ADS] [CrossRef] [Google Scholar]
- Chomiuk, L., Krauss, M. I., Rupen, M. P., et al. 2012, ApJ, 761, 173 [NASA ADS] [CrossRef] [Google Scholar]
- Chomiuk, L., Linford, J. D., Yang, J., et al. 2014, Nature, 514, 339 [NASA ADS] [CrossRef] [PubMed] [Google Scholar]
- Cunningham, T., Wolf, W. M., & Bildsten, L. 2015, ApJ, 803, 76 [NASA ADS] [CrossRef] [Google Scholar]
- Finzell, T., Chomiuk, L., Munari, U., & Walter, F. M. 2015, ApJ, 809, 160 [NASA ADS] [CrossRef] [Google Scholar]
- Finzell, T., Chomiuk, L., Metzger, B. D., et al. 2018, ApJ, 852, 108 [NASA ADS] [CrossRef] [Google Scholar]
- Franckowiak, A., Jean, P., Wood, M., Cheung, C.C., & Buson, S. 2018, A&A, 609, A120 [NASA ADS] [CrossRef] [EDP Sciences] [Google Scholar]
- Gorbatskii, V. G. 1962, AZh, 39, 198 [NASA ADS] [Google Scholar]
- Kato, M., & Hachisu, I. 1994, ApJ, 437, 802 [NASA ADS] [CrossRef] [Google Scholar]
- Li, K.-L., & Chomiuk, L. 2016, ATel, 9699 [Google Scholar]
- Li, K.-L., Chomiuk, L., & Strader, J. 2016, ATel, 9736 [Google Scholar]
- Li, K.-L., Metzger, B. D., Chomiuk, L., et al. 2017, Nature Astronomy, 1, 697 [Google Scholar]
- Linford, J. D., Ribeiro, V. A. R. M., Chomiuk, L., et al. 2015, ApJ, 805, 136 [NASA ADS] [CrossRef] [Google Scholar]
- Martin, P., & Dubus, G. 2013, A&A, 551, A37 [NASA ADS] [CrossRef] [EDP Sciences] [Google Scholar]
- Metzger, B. D., Hascoët, R., Vurm, I., et al. 2014, MNRAS, 442, 713 [NASA ADS] [CrossRef] [Google Scholar]
- Metzger, B. D., Finzell, T., Vurm, I., et al. 2015, MNRAS, 450, 2739 [NASA ADS] [CrossRef] [Google Scholar]
- Metzger, B. D., Caprioli, D., Vurm, I., et al. 2016, MNRAS, 457, 1786 [NASA ADS] [CrossRef] [Google Scholar]
- Mignone, A., Zanni, C., Tzeferacos, P., et al. 2012, ApJS, 198, 7 [Google Scholar]
- Munari, U., Margoni, R., & Stagni, R. 1990, MNRAS, 242, 653 [NASA ADS] [Google Scholar]
- Prialnik, D. 1986, ApJ, 310, 222 [NASA ADS] [CrossRef] [Google Scholar]
- Quataert, E., Fernández, R., Kasen, D., Klion, H., & Paxton, B. 2016, MNRAS, 458, 1214 [NASA ADS] [CrossRef] [Google Scholar]
- Rybicki, G. B., & Lightman, A. P. 1986, Radiative Processes in Astrophysics (Wiley-VCH) [Google Scholar]
- Schaefer, G. H., Brummelaar, T. T., Gies, D. R., et al. 2014, Nature, 515, 234 [NASA ADS] [CrossRef] [PubMed] [Google Scholar]
- Schlickeiser, R. 2002, Cosmic Ray Astrophysics (Berlin: Springer) [CrossRef] [Google Scholar]
- Schure, K. M., Kosenko, D., Kaastra, J. S., Keppens, R., & Vink, J. 2009, A&A, 508, 751 [NASA ADS] [CrossRef] [EDP Sciences] [Google Scholar]
- Shore, S. N., Schwarz, G. J., Walter, F. M., et al. 2014, ATel, 6413 [Google Scholar]
- Skopal, A., Drechsel, H., Tarasova, T., et al. 2014, A&A, 569, A112 [NASA ADS] [CrossRef] [EDP Sciences] [Google Scholar]
- Vlasov, A., Vurm, I., & Metzger, B. D. 2016, MNRAS, 463, 394 [NASA ADS] [CrossRef] [Google Scholar]
- Völk, H. J., Berezhko, E. G., & Ksenofontov, L. T. 2005, A&A, 433, 229 [NASA ADS] [CrossRef] [EDP Sciences] [Google Scholar]
- Vurm, I., & Metzger, B. D. 2018, ApJ, 852, 62 [NASA ADS] [CrossRef] [Google Scholar]
- Weston, J. H. S., Sokoloski, J. L., Chomiuk, L., et al. 2016a, MNRAS, 460, 2687 [NASA ADS] [CrossRef] [Google Scholar]
- Weston, J. H. S., Sokoloski, J. L., Metzger, B. D., et al. 2016b, MNRAS, 457, 887 [NASA ADS] [CrossRef] [Google Scholar]
The other three novae detected by the LAT in 2016 were not included in this work because their gamma-ray emission properties were not published, and their distances were still poorly determined.
Compared to the criterion of Eq. (23) in Metzger et al. (2016), which states that the upstream diffusion time should be lower than or equal to the advection time through the ionized layer ahead of the shock, the criterion of Eq. (21) yields comparable constraints for typical shock flow velocities of order 1000 km s−1.
We note that our 1σ uncertainty domain is underestimated because it hits the boundaries of our grid of models for some parameters.
All Tables
All Figures
|
Fig. 1 Structure of the interaction between a wind and a homologous ejecta with ρ ∝ r−2 from a computation using PLUTO with an isothermal equation of state. The left panels show the density and the velocity of the material. The right panels zoom in on the internal shock structure at the interface between the wind and the ejecta. Another shock structure appears at the interface between the ejecta and the ISM at r ≈ 1.6 AU. |
| In the text | |
|
Fig. 2 Photon light curves for four values of the gas compression factor in the cooling zone. The vertical dashed line marks the onset of the wind. |
| In the text | |
|
Fig. 3 Photon light curves and averaged spectra for four values of the wind mass-loss rate Ṁ w from 10−4 to 3 × 10⁻³ M⊙ yr−1. The verticaldashed line marks the onset of the wind. |
| In the text | |
|
Fig. 4 Photon light curves and averaged spectra for four values of the wind characteristic duration Dw of 5, 10, and 20 days and an infinite value to illustrate the case of a constant wind mass-loss rate. The vertical dashed line marks the onset of the wind. |
| In the text | |
|
Fig. 5 Photon light curves and averaged spectra for five values of the wind velocity vw from 1000 and 3000 km s−1. The verticaldashed line marks the onset of the wind. |
| In the text | |
|
Fig. 6 Photon light curves and averaged spectra for four values of the ejecta mass Mej from 10−5 and 3 ×10⁻⁴ M⊙. The verticaldashed line marks the onset of the wind. |
| In the text | |
|
Fig. 7 Photon light curves for a non-spherical case, with heavy and slow ejecta in the equatorial plane and light and fast ejecta in thepolar directions (obtained by linearly combining two runs and neglecting interactions at the boundaries; see text). |
| In the text | |
|
Fig. 8 Ratio of the gamma-ray luminosity to the reverse shock thermal power as a function of time, for a model with parameters (Mej, vej, vin, Ṁw, vw, Dw, tw) = (10−4, 1000, 10, 3 × 10⁻³, 2000, 10, 2) and a protoninjection fraction of 4 × 10⁻⁵. The red and orange vertical dashed lines mark the peak of the shock thermal power and gamma-ray luminosity, respectively. |
| In the text | |
|
Fig. 9 Model spectra fitted to Fermi-LAT observations for V407 Cyg, V1324 Sco, and V959 Mon (from top to bottom). The red solid curve corresponds to the best-fit model, whose parameters are listed in the top-right corner (f being the renormalization factor). The blue dotted curves correspond to model fits that are in the 68.3% confidence interval. |
| In the text | |
|
Fig. 10 Model light curves fitted to Fermi-LAT observations for V407 Cyg, V1324 Sco, and V959 Mon (from top to bottom). The red solid curve corresponds to the best-fit model, whose parameters are listed in the top-right corner (f being the renormalization factor). The blue dotted curves correspond to model fits that are in the 68.3% confidence interval. |
| In the text | |
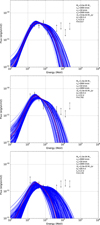 |
Fig. 11 Same as Fig. 9 for V339 Del, V1369 Cen, and V5668 Sgr (from top to bottom). |
| In the text | |
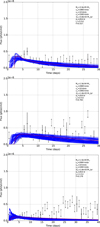 |
Fig. 12 Same as Fig. 10 for V339 Del, V1369 Cen, and V5668 Sgr (from top to bottom). |
| In the text | |
|
Fig. 13 Distribution of fit parameters for all models that are in the 68.3% confidence interval. Each dot corresponds to a fitted model and has a size that is inversely proportional to the reduced χ2 and a color that indicates the nova observation to which it was fitted (several dots are superimposed for most parameter combinations). Dots for the different novae are slightly offset horizontally and vertically from the exact parameter values for readability. |
| In the text | |
|
Fig. 14 Energy emitted in gamma-rays over the first 40 days as a function of the total wind energy (top panel) and ejecta energy (bottom panel), for all models that are in the 68.3% confidence interval. Each dot corresponds to a fitted model and has a size that is inversely proportional to the reduced χ2 and a color that indicates the nova observation to which it was fitted. |
| In the text | |
|
Fig. 15 Top panel: same as the top panel of Fig. 14, except that the color indicates the peak thermal power dissipated at the reverse shock. Bottom panel: same as the bottom panel of Fig. 14, except that the color indicates the peak thermal luminosity at 5GHz produced by the expanding ionized ejecta (undisturbed by internal shocks; see Sect. 4.5). |
| In the text | |
Current usage metrics show cumulative count of Article Views (full-text article views including HTML views, PDF and ePub downloads, according to the available data) and Abstracts Views on Vision4Press platform.
Data correspond to usage on the plateform after 2015. The current usage metrics is available 48-96 hours after online publication and is updated daily on week days.
Initial download of the metrics may take a while.