Fig. 15
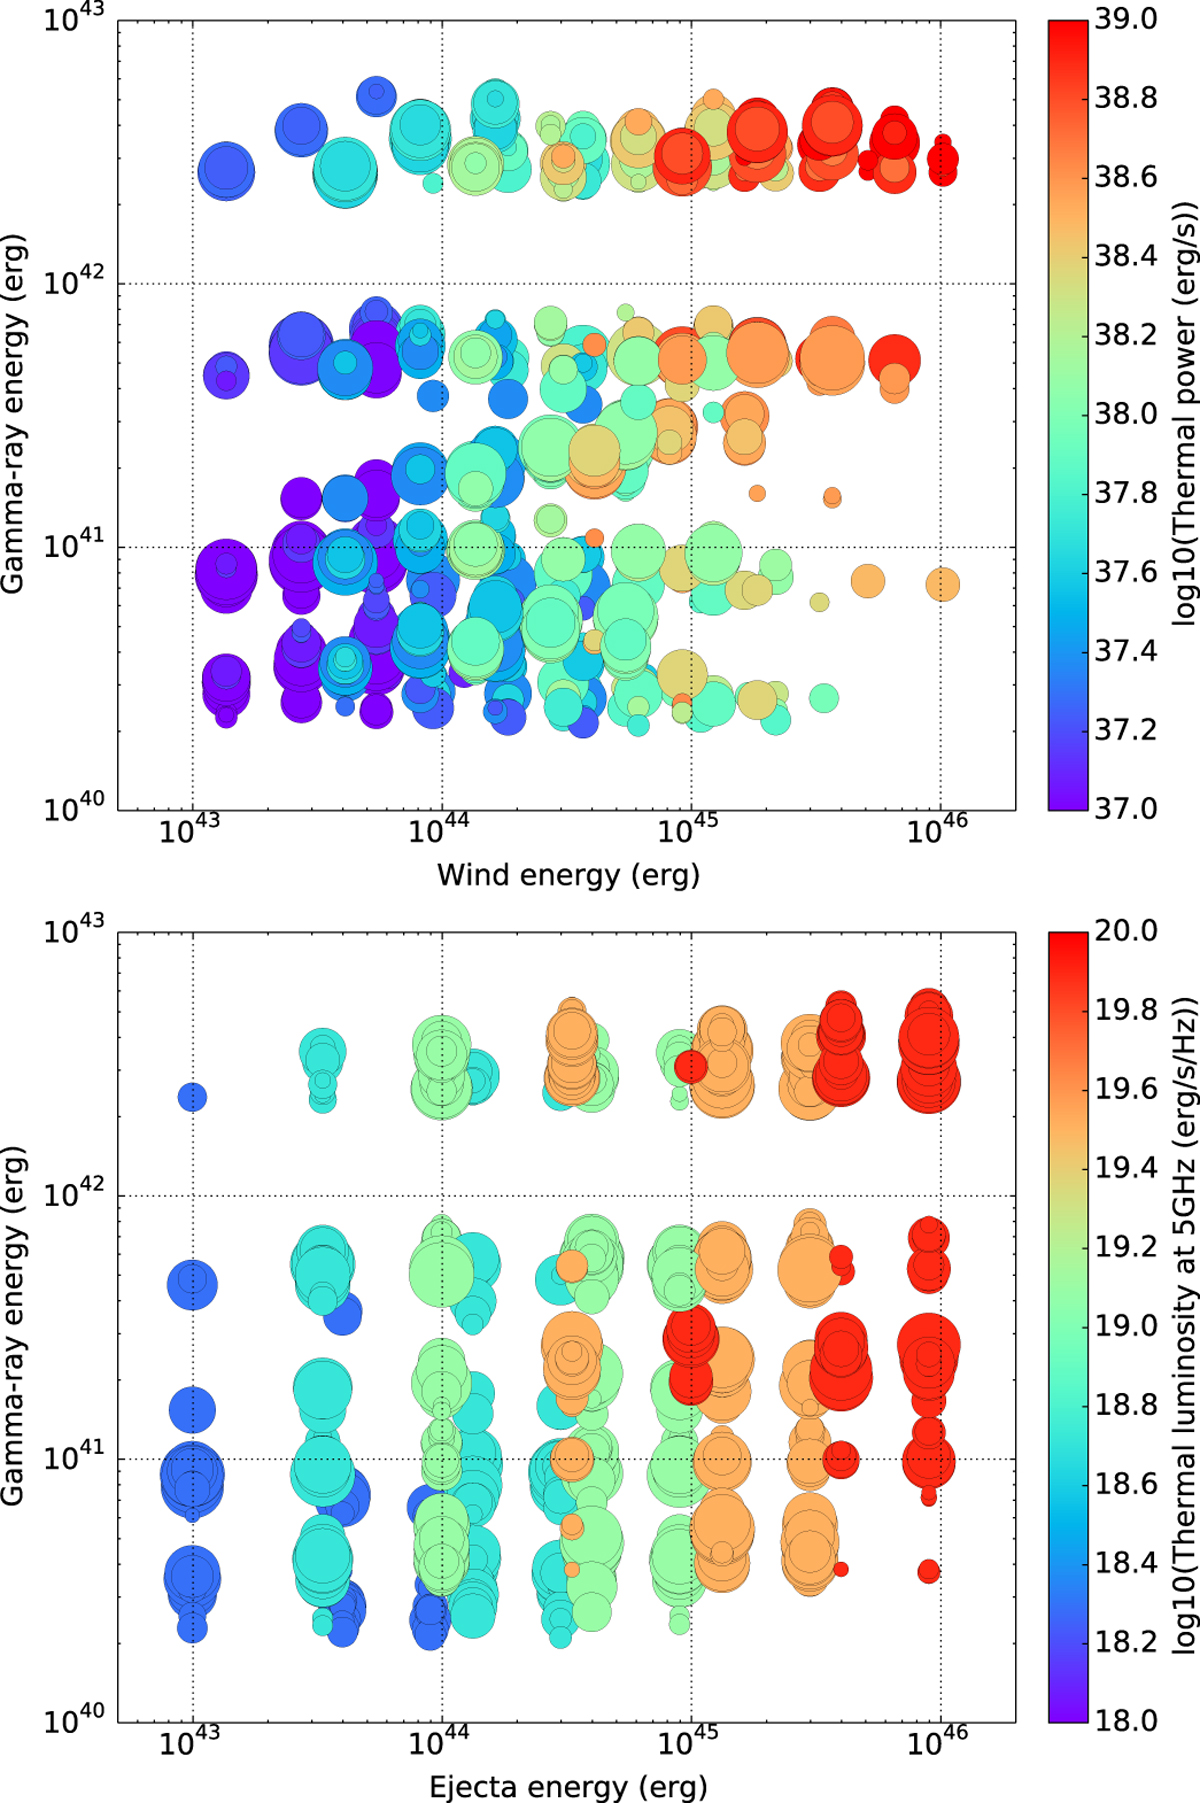
Top panel: same as the top panel of Fig. 14, except that the color indicates the peak thermal power dissipated at the reverse shock. Bottom panel: same as the bottom panel of Fig. 14, except that the color indicates the peak thermal luminosity at 5GHz produced by the expanding ionized ejecta (undisturbed by internal shocks; see Sect. 4.5).
Current usage metrics show cumulative count of Article Views (full-text article views including HTML views, PDF and ePub downloads, according to the available data) and Abstracts Views on Vision4Press platform.
Data correspond to usage on the plateform after 2015. The current usage metrics is available 48-96 hours after online publication and is updated daily on week days.
Initial download of the metrics may take a while.