Fig. 13
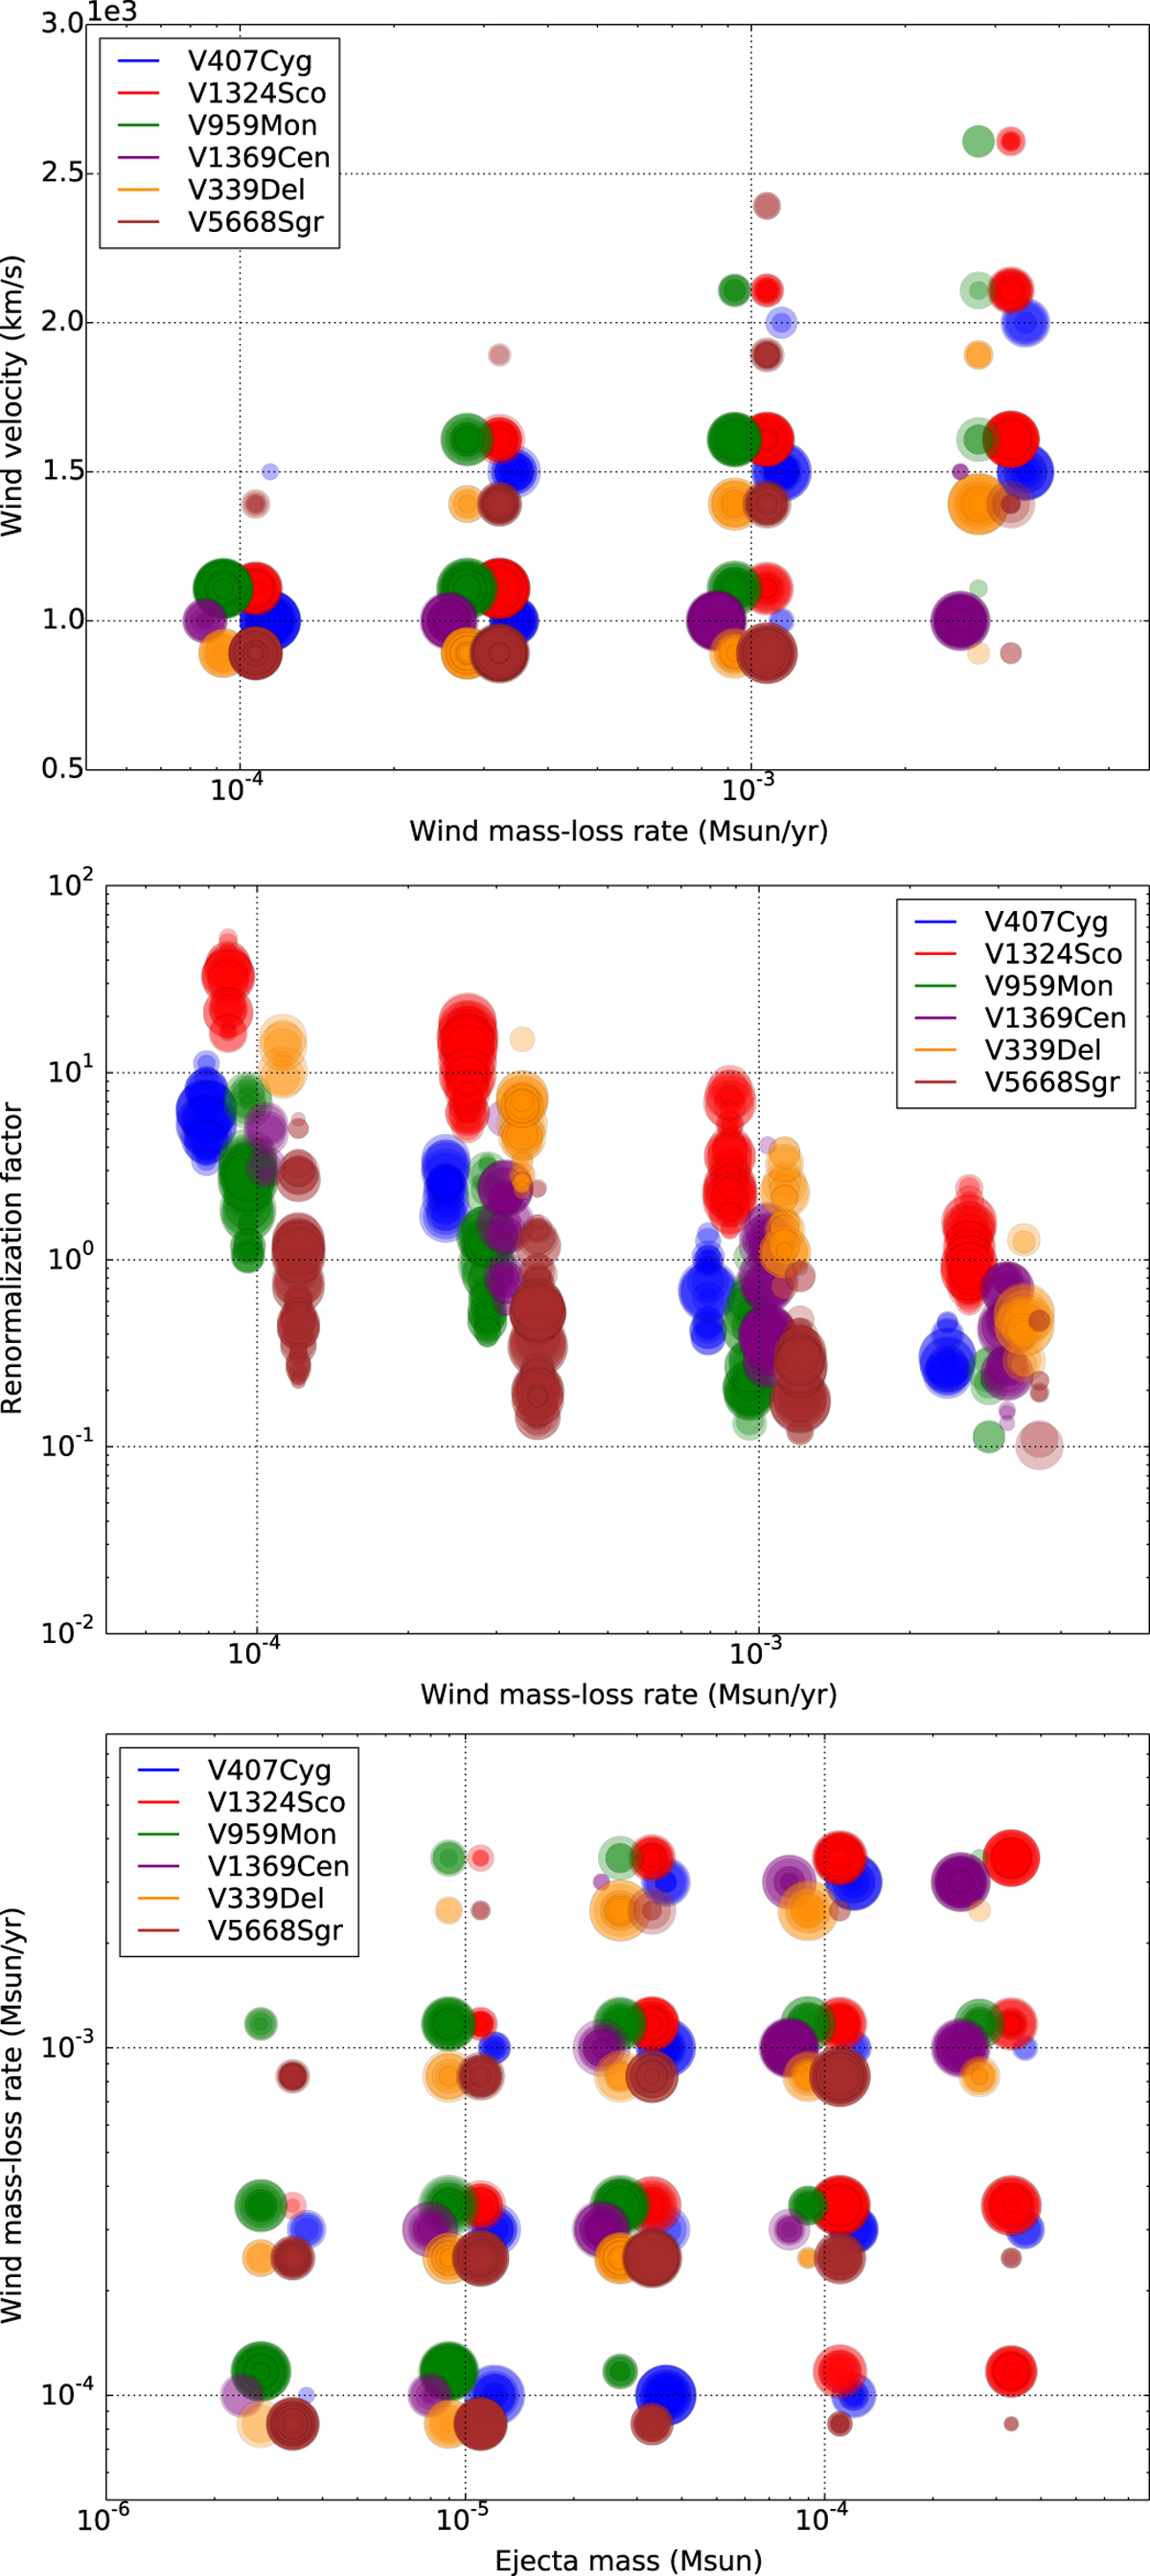
Distribution of fit parameters for all models that are in the 68.3% confidence interval. Each dot corresponds to a fitted model and has a size that is inversely proportional to the reduced χ2 and a color that indicates the nova observation to which it was fitted (several dots are superimposed for most parameter combinations). Dots for the different novae are slightly offset horizontally and vertically from the exact parameter values for readability.
Current usage metrics show cumulative count of Article Views (full-text article views including HTML views, PDF and ePub downloads, according to the available data) and Abstracts Views on Vision4Press platform.
Data correspond to usage on the plateform after 2015. The current usage metrics is available 48-96 hours after online publication and is updated daily on week days.
Initial download of the metrics may take a while.