Fig. 14
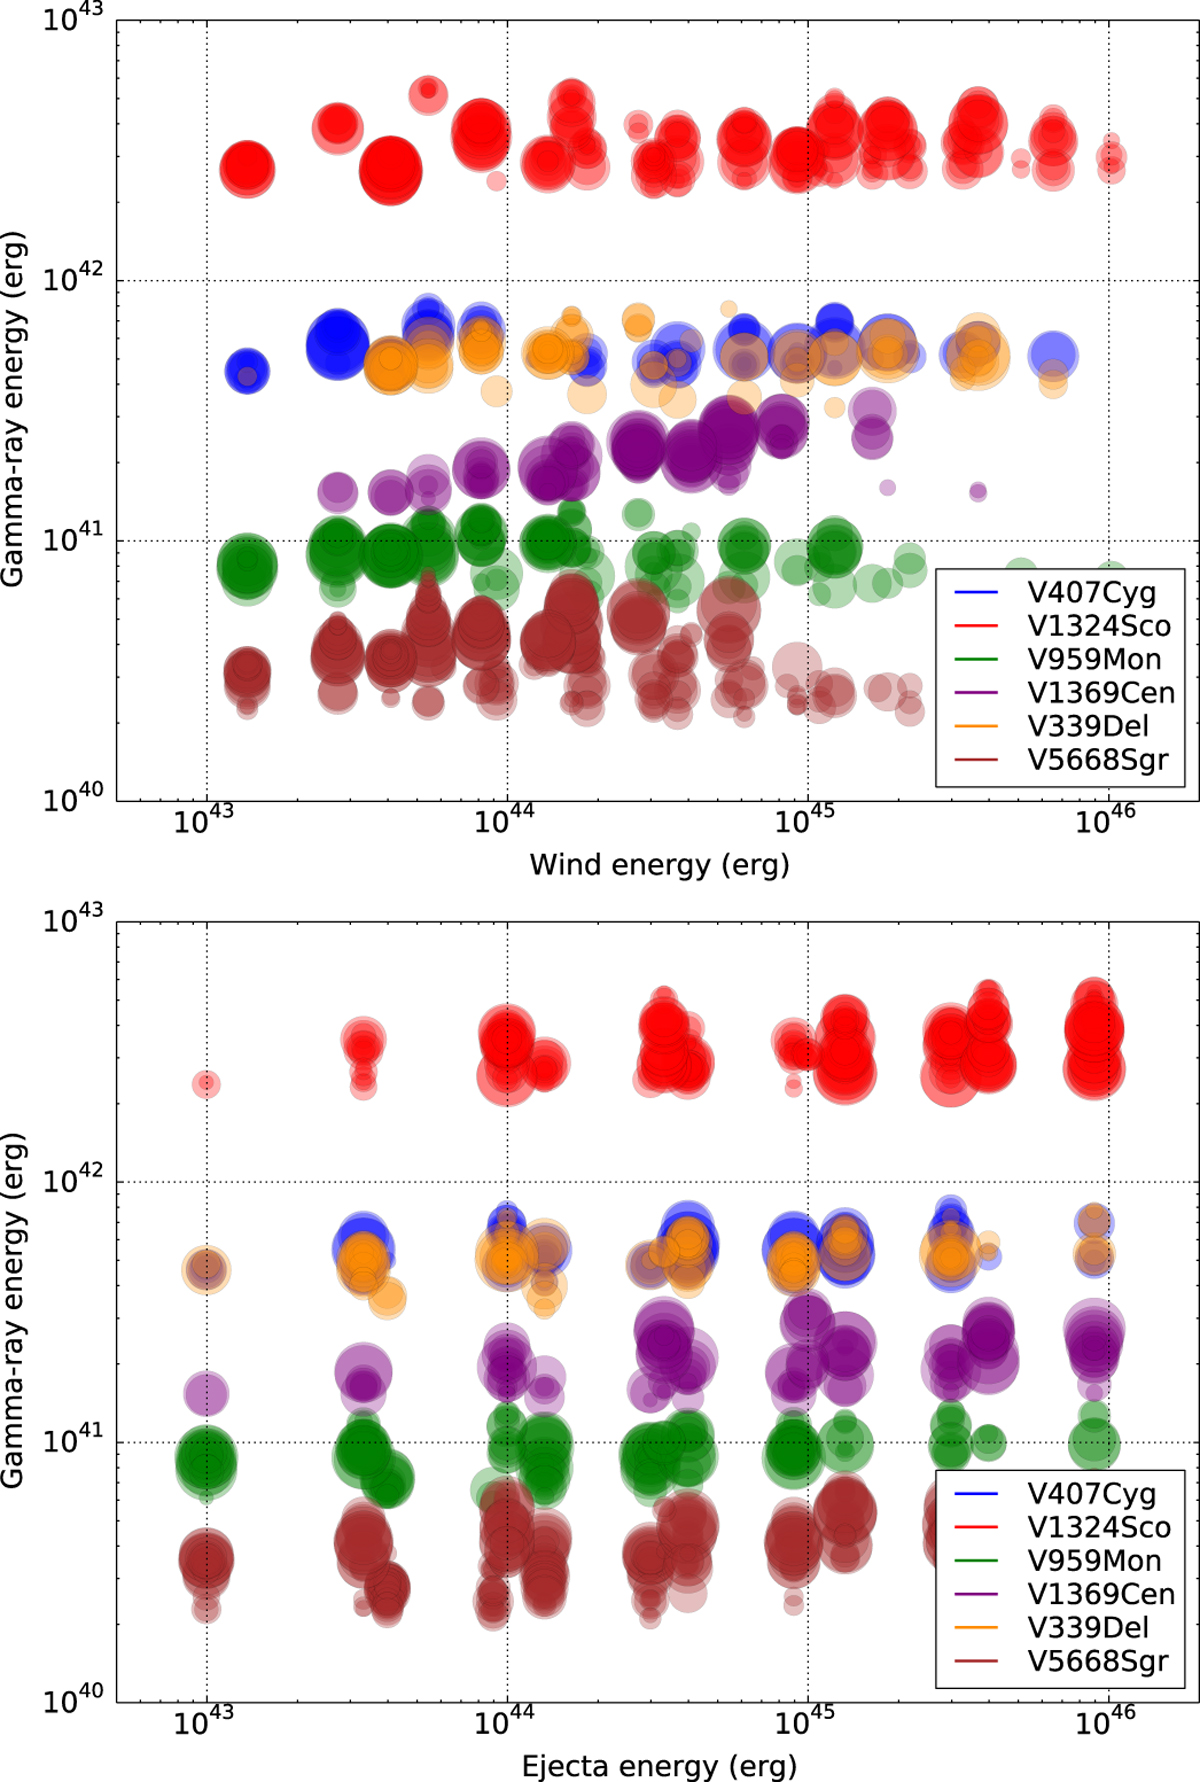
Energy emitted in gamma-rays over the first 40 days as a function of the total wind energy (top panel) and ejecta energy (bottom panel), for all models that are in the 68.3% confidence interval. Each dot corresponds to a fitted model and has a size that is inversely proportional to the reduced χ2 and a color that indicates the nova observation to which it was fitted.
Current usage metrics show cumulative count of Article Views (full-text article views including HTML views, PDF and ePub downloads, according to the available data) and Abstracts Views on Vision4Press platform.
Data correspond to usage on the plateform after 2015. The current usage metrics is available 48-96 hours after online publication and is updated daily on week days.
Initial download of the metrics may take a while.