Fig. 6
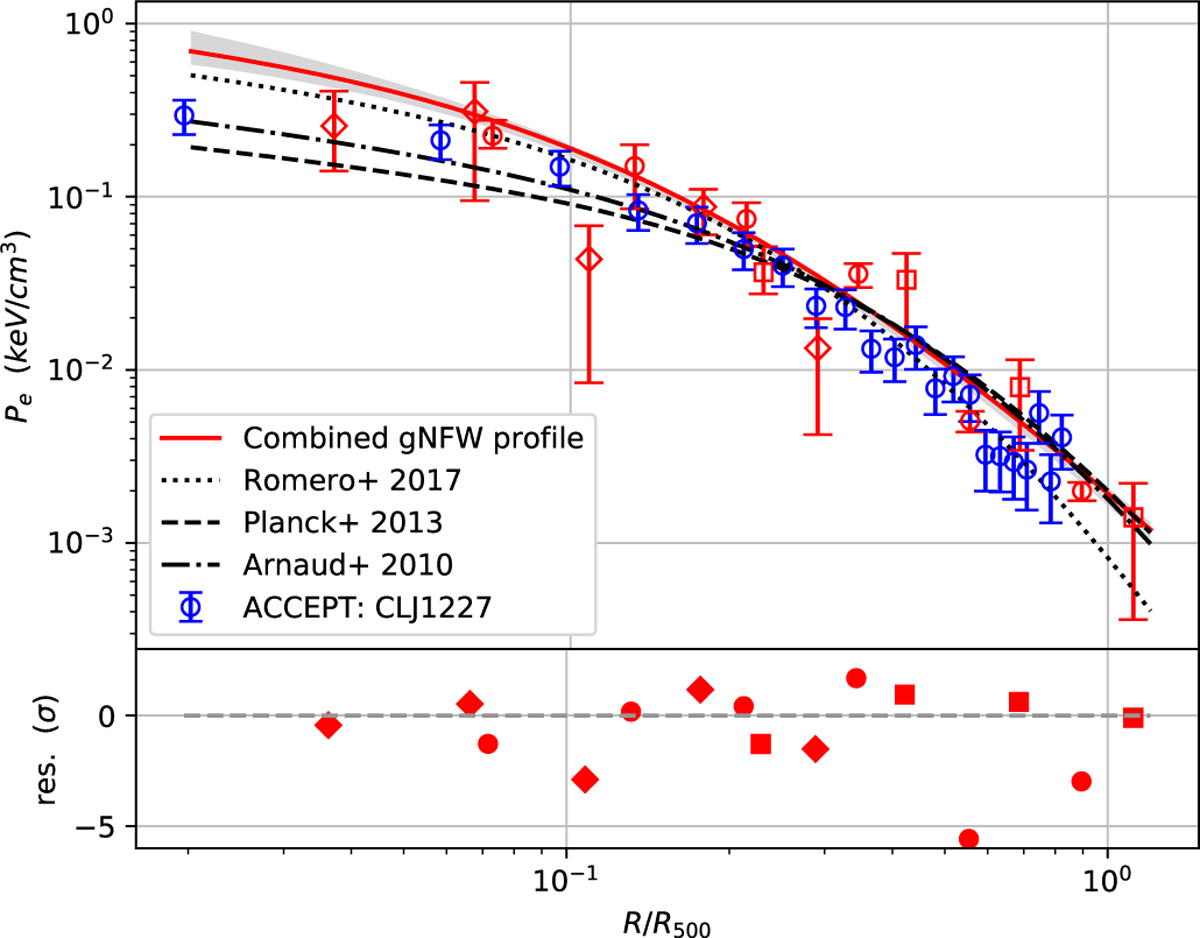
OurgNFW (parametric) pressure profile as simultaneously fit to the non-parametric pressure profiles is shown in red. The error bars are statistical, from the MCMC fits. The residual significances (σ, lower panel) are calculated from the asymmetric statistical errors (Table 2) and calibration errors. The non-parametric symbol-to-instrument association remains the same as in Figs. 2 and 3. The MUSTANG point that falls well (~ − 2.8σ) below the gNFW pressure profile (close to 0.1 R500) is of note and discussed in Sect. 6. The last two NIKA points fall − 5.5σ and − 2.8σ below the gNFW profile.
Current usage metrics show cumulative count of Article Views (full-text article views including HTML views, PDF and ePub downloads, according to the available data) and Abstracts Views on Vision4Press platform.
Data correspond to usage on the plateform after 2015. The current usage metrics is available 48-96 hours after online publication and is updated daily on week days.
Initial download of the metrics may take a while.