Fig. 4
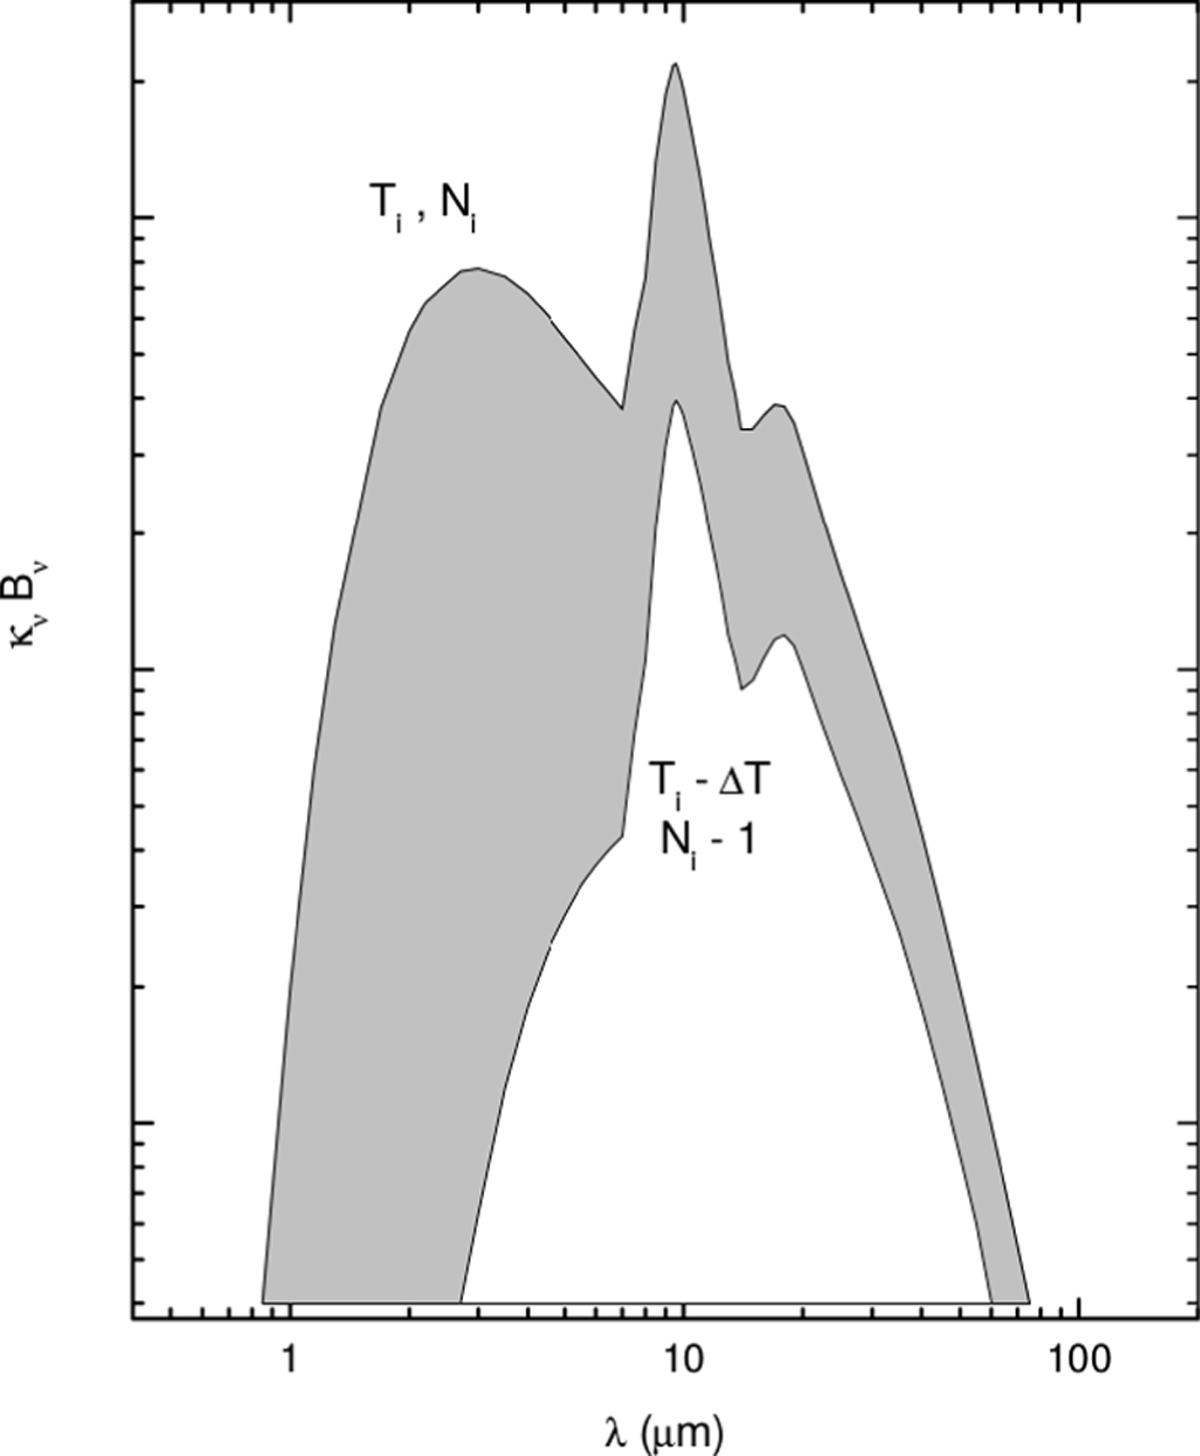
Temperature correction frequency distribution. Shown are the dust emissivities, jν = κν Bν(T), prior to andafter the absorption of a single photon packet. The spectrum of the previously emitted packets is given by the emissivity at the old cell temperature (bottom curve). To correct the spectrum from the old temperature to the new temperature(upper curve), the photon packet should be re-emitted using the difference spectrum (shaded area). Image from Bjorkman & Wood (2001).
Current usage metrics show cumulative count of Article Views (full-text article views including HTML views, PDF and ePub downloads, according to the available data) and Abstracts Views on Vision4Press platform.
Data correspond to usage on the plateform after 2015. The current usage metrics is available 48-96 hours after online publication and is updated daily on week days.
Initial download of the metrics may take a while.