| Issue |
A&A
Volume 611, March 2018
|
|
|---|---|---|
| Article Number | A74 | |
| Number of page(s) | 10 | |
| Section | Planets and planetary systems | |
| DOI | https://doi.org/10.1051/0004-6361/201732016 | |
| Published online | 29 March 2018 | |
Discovery of a point-like source and a third spiral arm in the transition disk around the Herbig Ae star MWC 758★
1
Space sciences, Technologies and Astrophysics Research (STAR) Institute, Université de Liège,
19 Allée du Six Août,
4000
Liège, Belgium
e-mail: This email address is being protected from spambots. You need JavaScript enabled to view it.
2
Departamento de Astronomía, Universidad de Chile,
Casilla 36-D,
Santiago, Chile
3
Millenium Nucleus “Protoplanetary Disks in ALMA Early Science”, Universidad de Chile,
Casilla
36-D,
Santiago, Chile
4
Department of Astronomy, California Institute of Technology,
1200 East California Boulevard, MC 249-17,
Pasadena,
CA
91125, USA
5
Jet Propulsion Laboratory, California Institute of Technology,
4800 Oak Grove Drive,
Pasadena,
CA
91109, USA
6
LESIA, Observatoire de Paris, PSL Research University, CNRS, Sorbonne Universités, UPMC Univ. Paris 06, Univ. Paris Diderot,
Sorbonne Paris Cité, 5 place Jules Janssen,
92195
Meudon, France
7
W. M. Keck Observatory,
65-1120 Mamalahoa Hwy.,
Kamuela,
HI
96743, USA
8
Mechanical & Aerospace Engineering, Princeton University,
Princeton,
NJ
08544, USA
9
Department of Engineering Sciences, Ångström Laboratory, Uppsala University,
Box 534, 751 21
Uppsala, Sweden
10
Argelander-Institut für Astronomie,
Auf dem Hügel 71,
53121
Bonn, Germany
Received:
29
September
2017
Accepted:
30
November
2017
Abstract
Context. Transition disks offer the extraordinary opportunity to look for newly born planets and to investigate the early stages of planet formation.
Aim. In this context we observed the Herbig A5 star MWC 758 with the L′-band vector vortex coronagraph installed in the near-infrared camera and spectrograph NIRC2 at the Keck II telescope, with the aim of unveiling the nature of the spiral structure by constraining the presence of planetary companions in the system.
Methods. Our high-contrast imaging observations show a bright (ΔL′ = 7.0 ± 0.3 mag) point-like emission south of MWC 758 at a deprojected separation of ~20 au (r = 0.′′111 ± 0.′′004) from the central star. We also recover the two spiral arms (southeast and northwest), already imaged by previous studies in polarized light, and discover a third arm to the southwest of the star. No additional companions were detected in the system down to 5 Jupiter masses beyond 0.′′6 from the star.
Results. We propose that the bright L′-band emission could be caused by the presence of an embedded and accreting protoplanet, although the possibility of it being an asymmetric disk feature cannot be excluded. The spiral structure is probably not related to the protoplanet candidate, unless on an inclined and eccentric orbit, and it could be due to one (or more) yet undetected planetary companions at the edge of or outside the spiral pattern. Future observations and additional simulations will be needed to shed light on the true nature of the point-like source and its link with the spiral arms.
Key words: protoplanetary disks / planet-disk interactions / stars: pre-main sequence / stars: individual: MWC 758 (HD 36112)
The reduced images (FITS files) are only available at the CDS via anonymous ftp to cdsarc.u-strasbg.fr (130.79.128.5) or via http://cdsarc.u-strasbg.fr/viz-bin/qcat?J/A+A/611/A74
F.R.S.-FNRS Research Associate.
Hubble Fellow.
© ESO 2018
1 Introduction
Understanding how planet formation takes place is a fundamental question in astronomy today. The ~3000 planets discovered in the last two decades thanks to various techniques allow astronomers to study planet mass and orbital parameter distributions, and their dependence on the properties of the host stars. Despite the important advancements made in the knowledge of planetary systems, many aspects concerning the initial conditions for planet formation and evolution still remain unknown. High angular resolution imaging of young protoplanetary disks in the closest star forming regions could provide answers to these questions. A variety of disk structures have been detected through infrared scattered light or mm-wave imaging. Circumstellar disks may present large cavities (e.g., Andrews et al. 2011), gaps and bright rings (e.g., Quanz et al. 2013), asymmetries (e.g., van der Marel et al. 2013), and spiral arms (e.g., Garufi et al. 2013; Benisty et al. 2015). In some cases the combination of polarized scattered light and millimeter measurements has even shown spatial segregation, which could be directly linked to the presence of planets (Pinilla et al. 2012a). Direct images of young planets embedded in protoplanetary disks would offer the possibility of investigating the link between the initial stages of planet formation and the final outcomes of the process.
In this context, MWC 758 (HD 36112) offers a unique environment to probe the existence of planetary companions and to explore the connection between disk structures and planet formation. MWC 758 is a young stellar object (3.5 ± 2 Myr, Meeus et al. 2012) at a distance of 151 pc (Gaia Collaboration 2016) close to the edge of the Taurus star forming region (stellar properties are given in Table 1). Measurements of resolved CO emission around the star determined the stellar mass to be 2.0 ± 0.2 M⊙ and the disk to have an inclination of 21° ± 2° and a position angle of the semi-major axis of 65° ± 7° (Isella et al. 2010). The mass and age estimates were based on the previously adopted hipparcos distances of 200 pc (van den Ancker et al. 1998) and 279 pc (van Leeuwen 2007). Given the revised Gaia distance, the star could be older and lighter than previously thought. In this paper, we assume a stellar mass of 1.5 ±0.2 M⊙, reflecting the scaling of the dynamical mass estimate to the new Gaia distance. Based on its SED, MWC 758 has been classified as a pre-transition disk (Grady et al. 2013). Although a cavity of 55 astronomical units (au) in radius has been inferred from dust millimeter emission (Andrews et al. 2011), infrared polarized intensity observations have found no clear evidence for a cavity in scattered light (Grady et al. 2013; Benisty et al. 2015). Using Ks-band (2.15 μm) direct imaging andH-band (1.65 μm) polarimetric imaging with the High-Contrast Instrument with Adaptive Optics (HiCIAO) at the Subaru Telescope, Grady et al. (2013) detected two spiral arms and polarized light down to 0.′′ 1 (15 au) from the star. Recent VLT Spectro-Polarimetric High-contrast Exoplanet REsearch (SPHERE) observations in the Y band (1.04 μm) have confirmed the presence of scattered light at least down to 14 au (Benisty et al. 2015). The asymmetries observed by Isella et al. (2010) in the mm-dust distribution and in CO emission suggest that the disk may be gravitationally perturbed by a low-mass companion orbiting within a radius of 23 au (assuming a distance of 151 pc). The asymmetric cm-dust distribution was shown to follow the location of the mm-dust (Marino et al. 2015a), hinting towards the hypothesis of a dust trap, which could also be created by a companion in the gap through the Rossby wave instability (e.g., Pinilla et al. 2012b). Hydrodynamical simulations of the disk indicate that the observed spirals could instead be launched by a massive planet or brown dwarf at larger separations (~ 100 au based on the revised Gaia distance, Dong et al. 2015b). The presence of stellar companions down to a mass limit of 12 MJup at 0.′′ 25 and of planets outside 0.′′5 (5 MJup at 0.′′ 5, and 3 MJup at 1′′ , according to the BT-SETTL models; Allard et al. 2012) has been ruled out based on a combination of sparse aperture masking observations at L′ band and angular differential imaging at K′ and Ks bands (Grady et al. 2013).
In this paper we present high-contrast imaging observations of the Herbig Ae star MWC 758 obtained with the near-infrared camera and spectrograph NIRC2 camera at the Keck II telescope in the L′ band (3.8 μm). Thanks to the use of the Keck adaptive optics system, combined with the recently commissioned vortex coronagraph and with high-contrast differential imaging techniques, the observations of MWC 758 presented in this paper have achieved unprecedented sensitivity in the innermost 0.′′25 and allowedus to probe the existence of planetary companions down to 0.′′ 08. In Sect. 2, we summarize the observations that we carried out and the data reduction process. The results are described inSect. 3. We discuss the nature of the point-like source and the origin of the spiral arms in Sects. 4.1 and 4.2, respectively. Finally in Sect. 5 we present our conclusions.
Stellar properties.
2 Observations and data reduction
MWC 758 was observed twice (see Table 2) with the Keck II telescope at the W. M. Keck Observatory, taking advantage of the L′-band vector vortex coronagraph installed in the near-infrared camera and spectrograph NIRC2 (Serabyn et al. 2017). This vector vortex coronagraph is a phase-mask coronagraph enabling high-contrast imaging close to the diffraction limit of the telescope ( ~0.′′08). On October24, 2015, we obtained 33 min (80 frames) of on-source integration time and 129° of field rotation (see Table 2) to allow for angular differential imaging (ADI, Marois et al. 2006). Each frame is the sum of 50 internally co-added frames of 0.5 s discrete integration time (DIT) each. During the coronagraphic acquisitions, the sky (DIT= 0.5 s) and the unsaturated stellar point-spreadfunction (PSF, DIT = 0.018 s) were also measured for background subtraction and photometric calibration purposes, respectively. The alignment of the star onto the coronagraph center is crucial for high contrast at small angles. In this case it was performed using the tip-tilt retrieval technique QACITS (Huby et al. 2015, 2017), as already implemented for HD 141569 (Mawet et al. 2017). Thanks to QACITS, we were able to reach a centering accuracy of 0.03λ∕D rms (3 mas rms). MWC 758 was then re-observed on October 24, 2016, following the same observing strategy as for the first epoch of observations(detailed information is given in Table 2). Due to cirrus clouds the weather conditions during this run were not as good as in the 2015 run.
Both data sets were preprocessed using the Vortex Image Processing package (VIP, Gomez Gonzalez et al. 2017). Images were divided by a flat field obtained without the vortex phase mask and the background emission (sky) was subtracted based on principal component analysis (PCA, Gomez Gonzalez et al. 2017; Hunziker et al. 2018). Bad pixel correction and bad frame removal were also applied to the data. Finally, the frames were re-centered through Fourier shift operations. For each epoch, the stellar PSF was subtracted by performing PCA (Amara & Quanz 2012; Soummer et al. 2012) to the full set of frames.
Observations.
3 Results
The final PCA-ADI L′-band images (Fig. 1) show a bright point-like emission source, detected south of MWC 758 (labeled b in Fig. 1a), at ~0.′′1 from the central star. The images also recover the two spiral arms (S1 and S2) already observed in near-infrared polarized light (Grady et al. 2013; Benisty et al. 2015), and reveal an additional one to the SW (S3).
In the following Sects. (3.1, 3.2, and in 3.3) we present the results in detail.
3.1 Point-like source in the disk
In the PCA-ADI residual images for both epochs, a bright L′ -band emission source is located at the same position interior to the spiral arms (see Fig. 1). For each data set, the final image corresponds to the number of principal components that maximize the signal-to-noise ratio (S/N) of the point-like feature (3 and 9 components, respectively). To compute the S/N, we follow the Mawet et al. (2014) prescription, where the signal is summed in a 1 full width at half maximum (FWHM) aperture around a given pixel, and the noise is computed as the standard deviation of the fluxes inside 1 FWHM apertures covering a 1 FWHM-wide annulus at the same radial distance from the center of the frame, taking into account the small sample statistic correction. In both data sets, the point-source is recovered with a S/N of ~ 5 . Figures 2a and b shows the S/N maps for the 2015 and 2016 final PCA-ADI images, respectively. None of the other bright features in the inner part of the disk (within 0.′′ 2) is recovered with a S∕N > 3.
To assess the reliability of the detection, we performed a series of tests. We varied the number of PCA coefficients and divided the two data sets into subsets containing either one-half or one-third of the frames, but covering the full field rotation. In both cases, the emission source south of MWC 758 appears to be the most significant feature in the final PCA-ADI images. We also inverted theparallactic angles of the frames, but we could not artificially generate any feature as bright as the one we detected.
The astrometry and photometry of the source are determined by inserting negative artificial planets in the individual frames, varying at the same time their brightness and location. The artificial companions are obtained from the unsaturated PSF of the star, which was measured without the coronagraph. The brightness and position that minimize the residual in the final images are estimated through a standard Nelder-Mead minimization algorithm. In the first epoch, the source is located at a distance r = 0.′′112 ± 0.′′006 from the central star at a position angle PA = 169° ± 4°, with a magnitude difference ΔL = 7.1 ± 0.3 mag. In the second data set, theestimated position is r = 0.′′110 ± 0.′′006 and PA = 162° ± 5°, and the flux ratio is ΔL′ = 6.9 ± 0.5 mag. The magnitude difference takes into account the vortex transmission (~50%) at these separations. The uncertainties on the quantities due to speckle noise were determined by injecting a series of fake companions around the star in the raw, companion-subtracted cube at the same radial distance, and calculating the median errors of the retrieved distributions. Variations in the total flux in the unsaturated PSF during the observing sequence were also included in the uncertainty on the brightness difference. The two measurements of separation, position angle and contrast, are consistent with each other within 1σ. If the spirals are trailing, a companion in the disk is expected to rotate clockwise. Given the distance of the source from the star and the time difference between the two epochs (1 year), orbital motion on a circular orbit would produce a displacement of ~ 5°, which is in line with our measurements.
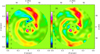 |
Fig. 2 S/N maps for the 2015 (a) and 2016 (b) data sets. Apart from b, none of the other bright features in the inner part of the disk (inside 0.′′ 2, down to the inner working angle at 0.′′08) is recovered with a S∕N > 3. |
3.2 Upper limits on other companions
Apart from b, the only other point-like source observed in the field of view is the star located at 2.′′ 3 to the NW, identified by (Grady et al. 2013) as a background source. In order to calculate robust detection limits, assess the mass constraints for other companions around MWC 758, and mitigate some of the shortcomings of standard contrast curves, we adopted the concepts of false positive fraction (FPF ) and true positive fraction (TPF, Wahhaj et al. 2013; Ruane et al. 2017).
Under the hypothesis that after subtracting the stellar PSF the noise in the image can be considered Gaussian (Mawet et al. 2014), and after setting an acceptable fraction (1%) of false positive in our field of view (a region of 1′′ × 1′′), we computed the signal level corresponding to a given completeness level (Ruane et al. 2017). We adopted a 95% completeness, or TPF = 0.95, which means that such a signal would be detected 95% of the time. The contrast curve at 95% completeness is plotted as a function of angular distance in Fig. 3. In the inner 0.′′ 6, the sensitivity is limited by the scattered light emission from the spirals between 30 and 90 au. Beyond 0.′′ 6, the sensitivity becomes almost constant (background-limited) and we can exclude planetary-mass companions down to ~ 5 MJup (see Fig. 3) according to the BT-SETTL evolutionary model (Allard et al. 2012).
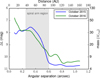 |
Fig. 3 Detection limits at 95% completeness around MWC 758 for the October 2015 (blue line) and the October 2016 (green line) data sets. A false alarm probability of 1% is allowed in our field of view (see Sect. 3.2). The inner region indicated by the gray area is dominated by the presence of the spirals arms. Outward, our detection limits for the October 2015 data set are close to 5 MJup, according tothe BT-SETTL evolutionary model (Allard et al. 2012). |
3.3 Spiral arms
Both the October 2015 and October 2016 final images (Figs. 1a and b) show the two bright spiral arms (S1 and S2) already detected in H- and Y -band polarized light (Grady et al. 2013; Benisty et al. 2015), and a third fainter spiral to the SW (S3), which has not yet been reported. A detailed discussion on the reliability of the detection of the third arm is given in Appendix B. In addition to the three spirals, we recover the bright second arc, shifted radially outward from S1, observed in polarized light at PA ~ 325° by Benisty et al. (2015). We refer to it as feature ii in Fig. 4.
A comparison of our image with the polarized light images of Benisty et al. (2015) also reveals several differences. First, the bright Y -band arc located at ~ 0.′′2 separation and covering a PA range of 180° − 270° (feature 2 in Benisty et al. 2015) appears much less prominent in L′-band, but is still recovered at the same location as in the polarized light image. A possible reason for the significant damping of the arc in our image is the tendency of ADI to self-subtract extended axisymmetric signal. Second, while S1 and the Y -band arc appear smoothly connected in the polarized image, this is not the case in our L′ -band images, where a clumpy structure is distinguished close to the root of S1 (feature i in Fig. 4). Part of the reason for such discontinuity could be the ADI filtering of a slightly overilluminated area of the spiral, as ADI is known to produce negative azimuthal lobes. Alternatively, this could indicate that it is tracing a different physical process (e.g., the merging of S1 and S2).
To characterize the spiral arms and features i and ii, we identified their trace as radial intensity maxima in azimuthal steps of 1°. This was done both in the final PCA-ADI image and in a deprojected one, based on a disk inclination of 21° and a PA of the semi-major axis of 65° (Isella et al. 2010). The deprojected image is shown in Fig. 4. Only the October 2015 PCA-ADI final image was used as it reaches better sensitivity than the October 2016 data set. The trace of the spirals then allowed us to measure their pitch angles, defined at each point as the angle between the tangent to the spiral and the local azimuthal vector. For each trace, the pitch angle was estimated in two different ways: (a) we considered the average value of the pitch angle computed from all pairs of consecutive points in the trace and (b) we derived the pitch angle of the best fit logarithmic spiral given by r = aebθ. Logarithmicspiral arms have the property of keeping a constant pitch angle throughout their length, given by the complementary of arctan(1∕b). Both methods yielded consistent measurements, although method (a) led to larger uncertainties.
Figure 5 shows the pitch angles measured with method (b) for each feature identified in Fig. 4. We measured the evolution of the pitch angle over S2 and S3 using method (b) on consecutive sections of the spirals separated by 5° and subtending each 50°. A single measurement using method (b) is provided for S1, features i and ii, due to the short PA range they subtend. We first notice that the pitch angle of feature i is slightly negative (quasi-null), which suggests that it is more likely related to the Y -band circular arc than to S1. We also note that the root of S3 (PA < 150°) shows a more significant pitch angle than the rest of S3. This could imply that it is either tracing a feature of the disk unrelated to S3 or that ADI filtering significantly alters the shape of S3 at such close separation. Overall, S1 and feature ii present a slightly larger pitch angle than both S2 or S3. The difference is more significant after deprojection ( ~ 20° instead of ~ 7−16°). It appears thus more likely that feature ii is related to S1 than S3, although the possibility that feature ii traces the outer tip of S3 cannot be completely ruled out in view of the strong fluctuations in the pitch angle of both S2 and S3 (up to 10°). The distortion ofthe spirals induced by the disk deprojection also appears to enhance the drop in pitch angle along the PA of the semi-major axis (65 ± 7° and 245 ± 7°) for both S2 and S3. Implications are discussed further in Sect. 4.2.
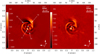 |
Fig. 1 Final PCA-ADI images for the 2015 (a) and 2016 (b) data sets. Three spiral arms and a bright point-like feature are detected in the images. The three spiral arms and the point-like source are labeled S1, S2, S3, and b, respectively. |
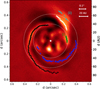 |
Fig. 4 Deprojected disk image from the 2015 data set showing the trace of S1 (white), S2 (black), S3 (blue), and features i (green) and ii (cyan). The dotted circles have 40 au and 63 au radial separations, and represent the limits within which the separation angle is computed between each pair of spirals (Fig. 7). |
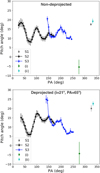 |
Fig. 5 Pitch angle of each spiral, in the non-deprojected (top) and deprojected image (bottom). For each measurement, we considered either the whole trace (for S1, features i and ii), or consecutive arcs subtending 50° (for S2 and S3) to trace the evolution of the pitch angle along the trace in order to provide reliable pitch angle estimates. The estimate for feature ii has a larger uncertainty because its trace only subtends ~ 25°, instead of ~ 50° for S1 and feature ii. |
4 Discussion
4.1 Nature of the point-like source
If we take a mean weighted by the errors of the estimates of the two epochs, the point-like source is located at an angular separation of 0.′′ 111 ± 0.′′004 with a magnitude difference of ΔL′ = 7.0 ± 0.3 mag. Given the distance of the star (151 pc; Gaia Collaboration 2016), and assuming the disk to be nearly face on (Isella et al. 2010), the physical separation from the central star is 16.7 ± 0.6 au. Taking into account the inclination of the disk, the bright emission would be at 20±1 au (assuming co-planarity, as shown in Fig. 4).
To explain the nature of the point-like source, we explored different possibilities. Comparing the separation and the brightness of the source with the TRILEGAL tridimensional model of the galaxy (Girardi et al. 2012), we can safely reject the hypothesis that the bright emission is a background star (probability ≃ 10−6). If the L′-band emission came from the photosphere of a low-mass companion, its mass would range between 41–64 Jupiter masses (MJup) according to the BT-SETTL evolutionary models (Allard et al. 2012). However, the non-detection of a fully depleted cavity in micrometer-size dust, requiring a steady replenishment of small particles, restricts the mass of companions in the inner disk of MWC 758 to be ≲ 5.5 MJup (Pinilla et al. 2015), or even smaller depending on the assumed model (e.g., a 1 MJup planet should already start opening a gap in the gas distribution, Dong & Fung 2017b; Fouchet et al. 2010; Paardekooper & Mellema 2004). With such mass constraints, only a protoplanet (hence MWC 758 b) surrounded by a circumplanetary accretion disk could account for the observed brightness. According to the circumplanetary disk accretion models of Zhu (2015), its L′ -band luminosity is compatible with a 0.5–5 MJup planet accreting at a rate of 10−7−10−9 M⊙ yr−1 (see Fig. 6). The corresponding K-band magnitude difference with the star ( ~7–9 mag) would be consistent with the non-detection of MWC 758 b in previous images at this wavelength (Grady et al. 2013). Due to the highly structured nature of the inner disk, we cannot discard the possibility that the point-like source is associated with an asymmetric disk feature, as recently suggested for HD 169142 (Ligi et al. 2018). However, only future observations, for instance the lack of orbital motion or the detection (or not) of Hα emission, can test this hypothesis.
In addition to these potential astrophysical origins, we also consider the possibility that the point-like source corresponds to a false positive detection, i.e., a bright speckle appearing twice at the same location. We show in Appendix A that, under the assumption of Gaussian noise, the astrophysical explanation is favored at an odds ratio of ~1000:1 with respectto the false positive hypothesis.
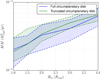 |
Fig. 6 Circumplanetary disk accretion models from Zhu (2015). The product of the mass of the planet and the disk
accretion rate (MpṀ)
changes as a function of the disk inner radius (Rin).
The solid blue and green lines represent the MpṀ vs. Rin
curve for the measured L′-band
absolute magnitude ( |

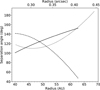 |
Fig. 7 Separation angle between S1 and S2 (solid line), between S1 and S3 (dashed line), and between S2 and S3 (dotted line). |
4.2 Spiral arms
Three spiral arms are detected at L′-band, which most likely traces scattered stellar light by submicrometer-size dust. The detection of S3 in L′ -band and its non-detection with polarized light at shorter wavelengths could be explained by the different dust scattering properties at L′ -band (3.8 μm) compared toY -band (1.04 μm). If the emission traces Rayleigh scattering of submicrometer-size grains (cross-section ∝ λ−4), then Y -band would trace mostly the disk surface,while L′-band could probedeeper layers of the disk. Therefore, the non-detection of S3 at Y -band could mean that it has a smaller scale height than S1 and S2. The different appearance of feature i at Y - and L′ -band could also be due to the tracing of different disk layers, or to ADI filtering, as discussed in Sect. 3.3. Part of the L′ -band emission could also trace shocks occurring in the spiral wake, as they could significantly heat the disk locally (e.g., Richert et al. 2015; Lyra et al. 2016). However, Rafikov (2016) argues that the increase in temperature due to shocks should be negligible, meaning that the observed spirals would only trace scattered stellar light.
Regarding the origin of feature ii, we note a striking resemblance with the double arc seen in the disk of HD 100453 (Benisty et al. 2017). It was suggested that this feature can be explained as the scattering surface of the bottom side of the disk. In the case of MWC 758, we note that this explanation is consistent with the estimated inclination and PA of the outer disk (i ~21°, PA ~ 65°) since such a double feature is expected to be more prominent along the semi-minor axis of the disk. If this interpretation is correct, the NW side of the outer disk is closer to us than the SE side.
Could any of the observed spirals be launched by the candidate companion? Hydrodynamical simulations and corresponding radiative transfer models suggest that observable spirals in near-infrared light could only be launched by companions massive enough for the linear spiral density wave theory to break down (Juhász et al. 2015; Dong & Fung 2017a). In this case, the planet responsible for the spiral structure would be located at the edge of or outside the spiral arms in order to be able to reproduce the observed pitch angles (Dong et al. 2015b), indicating that the protoplanet candidate is most likely not responsible for the observed disk structure. However, the possibility that the candidate companion is on an inclined, eccentric orbit cannot be ruled out. Recent simulations suggest that a mild perturbation on the inclination of a companion in the inner disk can lead to a polar orbit within a few Myr (Owen & Lai 2017; Martin & Lubow 2017). In this case, spiral predictions from circular orbits co-planar with the disk would not be valid. Recent simulations in the case of the disk of HD 142527 indicate that the close-in companion with an inclined and eccentric orbit (Lacour et al. 2016) is able to qualitatively reproduce the spiral arm pattern in the outer disk (Price et al., in prep.). Similarly, some or all of the observed spirals in MWC 758 could be launched by the candidate companion if in the same plane as the inner disk, which is likely misaligned with respect to the outer disk. The difference in inclination is estimated between 10° and 30°, while the PA does not appear well constrained (Isella et al. 2006, 2008; Lazareff et al. 2017). Finally, the large fluctuations in the measured pitch angle along S2 and S3 could also be considered as a clue that the spirals are launched by a companion whose orbital plane is different from the plane of the outer disk. Indeed, if the spirals were seen face-on after deprojection, one would not expect significant variations in their opening angle (except in the direct vicinity of the companion; Zhu et al. 2015; Juhasz & Rosotti 2018). Nevertheless, our deprojection does not take into account the flaring of the disk, which may bias the measured pitch angles.
In the case that a massive, yet undetected companion located outside of the spirals is needed to account for the observed multiple spiral pattern, an empirical relationship has recently been established between the mass of the companion and the separation angle ϕsep between primary and secondary spiral arms, , where q is the mass ratio between the companion and the star (Fung & Dong 2015, hereafter FD15). In order to investigate the origin of the spirals of MWC 758, we measured the separation angle ϕsep between each pair of spiral arms between 40 and ~63 au, where all spirals are clearly defined in our final PCA-ADI image (Fig. 7). These measurements are based on geometrical fits of the spirals, and will be presented in Barraza et al. (in prep.). In the FD15 simulations, the separation angles are relatively constant with radius, with only a slight decreasing trend for all models with ϕsep> 80°. Here, for each pair of spirals, the observed separation angle appears to vary significantly with radius. Only in the limited range of radii ~40–55 au, ϕsep for the S1–S3 and the S2–S3 pairs are comparable to the FD15 models for q = 4 × 10⁻³ and q = 10−3, respectively. Considering a stellar mass of 1.5 M⊙, this would correspond to a companion mass of ~6 MJup (for S1–S3) and ~2 MJup (for S2–S3). The first possibility is consistent with our detection limits inside 90 au, while the second is compatible with our sensitivity limits at any radius (Fig. 3). Nevertheless, these predictions require the presence of a giant planet at large separation ( >80 au), which is expected to be very rare (e.g., Vigan et al. 2017). Furthermore, in the case that S1–S3 (resp. S2–S3) are launched byan external companion, another companion would still be required to account for S2 (resp. S1), except if S2 (resp. S1) happens to be a very bright tertiary arm, even brighter than the secondary arm (i.e., S3 in both cases).
For the sake of completeness, we also consider the possibility that the observed spiral pattern is induced by one or several other physical mechanisms. Hydrodynamical simulations have suggested that shadows producing a periodical perturbation in temperatureon the outer disk could be able to launch large-scale symmetrical spiral arms (Montesinos et al. 2016). In the case of an inclined inner disk with respect to the outer disk, two shadows are cast and a relatively symmetric two-arm spiral pattern forms in theouter disk. Nevertheless, there is no detection of conspicuous shadows similar to the case of HD 142527 (Avenhaus et al. 2014; Marino et al. 2015b) or HD 100453 (Benisty et al. 2017), which makes this possibility unlikely.
The flyby by an external star is also known to produce a one- or two-arm spiral pattern (e.g., Quillen et al. 2005). We investigated the possibility that MWC 758 could have undergone a flyby from the source located at 2.′′ 3. As detailed in Appendix C, the color and magnitude of the object are not compatible with a young object at the distance of Taurus, and could either correspond to an early red dwarf at the distance of MWC 758 or a red giant star much farther away. The probability that an old red dwarf happens to cross the star forming region of Taurus is very small, hence we favor the second hypothesis (background red giant).
Based on mm-dust continuum observations and assuming a fiducial gas-to-dust ratio of 100, the disk mass was estimated to 0.008 M⊙ (Andrews et al. 2011). Considering a stellar mass of 1.5 M⊙, the disk is about 50 times less massive than required to form spiral arms by self-gravity (Dong et al. 2015a). We note that this is also an argument against the possibility of the spirals being launched by shadows, as that mechanism might require a marginally stable disk (Montesinos et al. 2016).
5 Conclusions
The L′-band vortex coronagraph installed on Keck/NIRC2 was used to discover a point-like source with ~7.0 mag contrast in L′-band at only ~0.′′11 from the central star, and to reveal an additional spiral arm in the disk. Although the possibility of an asymmetric disk feature cannot be excluded, we argue that the L′~ 11.7 mag apparent magnitude emission ( , assuming a distance of 151 pc) is most likely due to an embedded protoplanet. In this case the newborn planet would be surrounded by an accreting circumplanetary disk, which may account for most of the observed luminosity. The presence of scattered light down to 15 au (Benisty et al. 2015) indicates that the planet should be small enough to have only marginally affected the inner part of the disk.
We considered several possibilities for the origin of the spiral arms. Neither disk self-gravity nor the source at ~2.′′3 (most likely a background red giant) appear to be able to account for the observed structures. Our analysis suggests that the most likely explanation for the observed spiral pattern involves (i) the candidate companion itself if it is on an inclined and eccentric orbit, possibly co-planar with the inner disk; (ii) the presence of an undetected ~ 6 MJup planet at the outer tip of S1; (iii) the presence of an undetected ~2 MJup planet at or outside the outer tip of S2; or (iv) a combination of the three explanations. The second and third cases are both compatible with our sensitivity constraints. The second case is similar to the prediction based on previous hydrodynamical simulations of the disk of MWC 758 (Dong et al. 2015b).
New dedicated simulations considering the revised distance of MWC 758 (151 pc, Gaia Collaboration 2016), and including the protoplanet, the third spiral arm, and our mass constraints in the outer disk, will enable the origin of the observed spiral pattern to be further constrained. Future re-detection (or non-detection) of the companion at other wavelengths will help us constrain its properties thanks to the comparison with SED predictions (Zhu 2015; Eisner 2015). Follow-ups with ALMA could probe the dynamics of the disk and also provide new insight into the nature of the bright L′ -band point-source. If the observed feature is an accreting circumplanetary disk, it is expected to leave an observable kinematic signature in ALMA observations (Perez et al. 2015). Its accretion nature could also be confirmed with direct imaging in the Hα line, as for HD 142527B (Close et al. 2014) or LkCa 15 (Sallum et al. 2015).
Acknowledgements
We would like to acknowledge the anonymous referee for the helpful comments. We thank Simon Casassus and Sebastián Perez for fruitful discussions on the spiral arms, and Farzana Meru for useful insights on disk cavities. This research was founded by the European Research Council under the European Union’s Seventh Framework Program (ERC Grant Agreement n. 337569) and by the French Community of Belgium through an ARC grant for Concerted Research Action. V.C. acknowledges support from CONICYT through CONICYT-PCHA/Doctorado Nacional/2016-21161112, and from the Millennium Science Initiative (Chilean Ministry of Economy), through grant RC130007. G.R. is supported by an NSF Astronomy and Astrophysics Postdoctoral Fellowship under award AST-1602444. E.C. acknowledges support from NASA through Hubble Fellowship grant HST-HF2-51355 awarded by STScI, operated by AURA Inc. for NASA under contract NAS5-2655. This work used data reprocessed as part of the ALICE program, which was supported by NASA through grant HST-AR-12652, HST-GO-11136, HST-GO-13855, HST-GO-1331, and STScI Director’s Discretionary Research Funds. The W. M. Keck Observatory is operated as a scientific partnership among the California Institute of Technology, the University of California, and NASA. The Observatory was made possible by the generous financial support of the W. M. Keck Foundation.
Appendix A Odds ratio calculation
To evaluate in a more rigorous way the confidence of the detection we constructed an odds ratio (OR ) between the likelihood of the planet (H1) and the false positive (H0) hypothesis. Based on the Bayes theorem, it can be calculated as
 (A.1)
(A.1)
where P(x|H1, μc) and P (x|H0) are the likelihood of the data given the signal with flux μc and the likelihood of the data given a false positive, respectively. P (H1)∕P(H0) is the ratio of the priors for H1 and H0. P (x|H0) can be evaluated from the S/N of the bright emission under Gaussian noise assumption. In this case, a 5σ detection corresponds to a probability of 0.12% using the Student t-distribution with 6 degrees of freedom (defined as the number of independent and identically distributed samples at a radial distance r, i.e., (2πr∕FWHM) − 2). P (x|H1, μc) can be estimated after removing the bright emission. There is a 50% chance that the noise is higher, and 50% that it is lower at that location, meaning P(x|H1, μc) = 0.5. To estimate the prior ratio, we considered the expected number of planets in a given mass and separation range around a ~ 2 M⊙ star. Preliminary analysis of the Gemini Planet Imager Exoplanet Survey gives a 6% probability of a 2 M⊙ star hosting a planet between 5–13 MJup in the 10–100 au separation range (Nielsen et al. 2017). The disk geometry and its L′ -band luminosity constrain the mass of the protoplanet around MWC 758 to be ~ 1−6 MJup. Assuming that planets follow the mass and semi-major axis distributions measured by radial-velocity surveys (Cumming et al. 2008), we estimated the likelihood of having a planet between 1–6 MJup and between 19–21 auto be P(H0) = 0.006 (hence, P(H1) = 1 −P(H0) = 0.994). Considering that we detected the point-source in two epochs, indicated here by the subscript a and b, the odds ratio becomes
 (A.2)
(A.2)
The planet hypothesis is thus favored at an odds ratio of 1048:1, providing high confidence that this is, indeed, a true companion.
Appendix B Reliability of the observed spirals
Angular differential imaging (ADI) is known to be an aggressive algorithm that can introduce biases in the results of disk image processing (Milli et al. 2012). We tested the effect of ADI on spiral features, by injecting two artificial spiral arms (similar to S1 and S2) intoan ADI cube obtained in similar conditions for a different source showing no disk emission. For this object, a reference star was also observed before and after the target observations to allow for reference star differential imaging (RDI, Mawet et al. 2013). In the residual images after PCA analysis, the injected spirals in the ADI data reduction appear to be sharper, but unchanged in shape, compared to RDI (see Fig. B.1). No tertiary arm is generated by the injections of the two spiral arms. These tests give us confidence that the structures detected in the final PCA-ADI images are real.
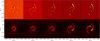 |
Fig. B.1 ADI and RDI comparison on artificial spirals. The top and bottom rows show the results of PCA-ADI and PCA-RDI, respectively, on artificially injected spirals. The injected spiral flux increases from left to right. |
Appendix C The source at 2.3"
After PSF subtraction, a source at a distance r = 2.′′315 ± 0.′′002 and PA = 316° ± 2° is recoveredin the final 2015 image (see Fig. C.1). Its L′ -band magnitude is L′ = 14.4 ± 0.1 mag. This source was previously classified as non-comoving (Grady et al. 2013) and as a background object based on its V -magnitude (Grady et al. 2005).
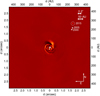 |
Fig. C.1 Wide-field view of MWC 758 from our L′-band 2015 data. Asource is detected at 2.′′3 from the star. Positions of the same object in the 2000 (Grady et al. 2005) and 2005 (Grady et al. 2013) HST observationsare plotted on the image, too. North is up and east is toward the left. |
A re-analysis of the archival STIS and NICMOS data sets Choquet et al. (2014) results in magnitudes V = 17.74 ± 0.03 and J =15.8 ± 0.1 assuming a Kurucz (Kurucz 1993) A2V stellar model, and V = 18.37 ± 0.03 and J = 15.5 ± 0.1 for a M2V spectral-type. The color information and absolute magnitudes are inconsistent with a young object at the distance of Taurus. They would rather suggests either an M4 main sequence star at the distance of MWC 758, or a red giant much farther away. Considering that the probability of an old M dwarf crossing the Taurus star forming region is small, we believe that the source at 2.′′ 3 is most likely a background red giant.
References
- Allard, F., Homeier, D., Freytag, B., & Sharp, C. M. 2012, in EAS Pub. Ser., eds. C. Reylé, C. Charbonnel, & M. Schultheis, 57, 3 [Google Scholar]
- Amara, A. & Quanz, S. P. 2012, MNRAS, 427, 948 [NASA ADS] [CrossRef] [Google Scholar]
- Andrews, S. M., Wilner, D. J., Espaillat, C., et al. 2011, ApJ, 732, 42 [NASA ADS] [CrossRef] [Google Scholar]
- Avenhaus, H., Quanz, S. P., Schmid, H. M., et al. 2014, ApJ, 781, 87 [NASA ADS] [CrossRef] [Google Scholar]
- Benisty, M., Juhasz, A., Boccaletti, A., et al. 2015, A&A, 578, L6 [NASA ADS] [CrossRef] [EDP Sciences] [Google Scholar]
- Benisty, M., Stolker, T., Pohl, A., et al. 2017, A&A, 597, A42 [NASA ADS] [CrossRef] [EDP Sciences] [Google Scholar]
- Choquet, É., Pueyo, L., Hagan, J. B., et al. 2014, in Space Telescopes and Instrumentation 2014: Optical, Infrared, and Millimeter Wave, Proc. SPIE, 9143, 914357 [CrossRef] [Google Scholar]
- Close, L. M., Follette, K. B., Males, J. R., et al. 2014, ApJ, 781, L30 [NASA ADS] [CrossRef] [Google Scholar]
- Cumming, A., Butler, R. P., Marcy, G. W., et al. 2008, PASP, 120, 531 [CrossRef] [Google Scholar]
- Dong, R. & Fung, J. 2017a, ApJ, 835, 38 [NASA ADS] [CrossRef] [Google Scholar]
- Dong, R. & Fung, J. 2017b, ApJ, 835, 146 [NASA ADS] [CrossRef] [Google Scholar]
- Dong, R., Hall, C., Rice, K., & Chiang, E. 2015a, ApJ, 812, L32 [NASA ADS] [CrossRef] [Google Scholar]
- Dong, R., Zhu, Z., Rafikov, R. R., & Stone, J. M. 2015b, ApJ, 809, L5 [NASA ADS] [CrossRef] [Google Scholar]
- Eisner, J. A. 2015, ApJ, 803, L4 [NASA ADS] [CrossRef] [Google Scholar]
- Fouchet, L., Gonzalez, J.-F., & Maddison, S. T. 2010, A&A, 518, A16 [NASA ADS] [CrossRef] [EDP Sciences] [Google Scholar]
- Fung, J. & Dong, R. 2015, ApJ, 815, L21 [NASA ADS] [CrossRef] [Google Scholar]
- Gaia Collaboration 2016, VizieR Online Data Catalog: I/337 [Google Scholar]
- Garufi, A., Quanz, S. P., Avenhaus, H., et al. 2013, A&A, 560, A105 [NASA ADS] [CrossRef] [EDP Sciences] [Google Scholar]
- Girardi, L., Barbieri, M., Groenewegen, M. A. T., et al. 2012, Astrophys. Space Sci. Proc., 26, 165 [Google Scholar]
- Gomez Gonzalez, C. A., Wertz, O., Absil, O., et al. 2017, AJ, 154, 7 [NASA ADS] [CrossRef] [Google Scholar]
- Grady, C. A., Woodgate, B. E., Bowers, C. W., et al. 2005, ApJ, 630, 958 [NASA ADS] [CrossRef] [Google Scholar]
- Grady, C. A., Muto, T., Hashimoto, J., et al. 2013, ApJ, 762, 48 [NASA ADS] [CrossRef] [Google Scholar]
- Huby, E., Baudoz, P., Mawet, D., & Absil, O. 2015, A&A, 584, A74 [NASA ADS] [CrossRef] [EDP Sciences] [Google Scholar]
- Huby, E., Bottom, M., Femenia, B., et al. 2017, A&A, 600, A46 [NASA ADS] [CrossRef] [EDP Sciences] [Google Scholar]
- Hunziker, S., Quanz, S. P., Amara, A., & Meyer, M. R. 2018, A&A, 611, A23 [NASA ADS] [CrossRef] [EDP Sciences] [Google Scholar]
- Isella, A., Testi, L., & Natta, A. 2006, A&A, 451, 951 [NASA ADS] [CrossRef] [EDP Sciences] [Google Scholar]
- Isella, A., Tatulli, E., Natta, A., & Testi, L. 2008, A&A, 483, L13 [NASA ADS] [CrossRef] [EDP Sciences] [Google Scholar]
- Isella, A., Natta, A., Wilner, D., Carpenter, J. M., & Testi, L. 2010, ApJ, 725, 1735 [NASA ADS] [CrossRef] [Google Scholar]
- Juhasz, A. & Rosotti, G. P. 2018, MNRAS, 474, L32 [NASA ADS] [CrossRef] [Google Scholar]
- Juhász, A., Benisty, M., Pohl, A., et al. 2015, MNRAS, 451, 1147 [NASA ADS] [CrossRef] [Google Scholar]
- Kurucz, R. L. 1993, VizieR Online Data Catalog: VI/39 [Google Scholar]
- Lacour, S., Biller, B., Cheetham, A., et al. 2016, A&A, 590, A90 [NASA ADS] [CrossRef] [EDP Sciences] [Google Scholar]
- Lazareff, B., Berger, J.-P., Kluska, J., et al. 2017, A&A, 599, A85 [NASA ADS] [CrossRef] [EDP Sciences] [Google Scholar]
- Ligi, R., Vigan, A., Gratton, R., et al. 2018, MNRAS, 473, 1774 [NASA ADS] [CrossRef] [Google Scholar]
- Lyra, W., Richert, A. J. W., Boley, A., et al. 2016, ApJ, 817, 102 [NASA ADS] [CrossRef] [Google Scholar]
- Malfait, K., Bogaert, E., & Waelkens, C. 1998, A&A, 331, 211 [NASA ADS] [Google Scholar]
- Marino, S., Casassus, S., Perez, S., et al. 2015a, ApJ, 813, 76 [NASA ADS] [CrossRef] [Google Scholar]
- Marino, S., Perez, S., & Casassus, S. 2015b, ApJ, 798, L44 [NASA ADS] [CrossRef] [Google Scholar]
- Marois, C., Lafrenière, D., Doyon, R., Macintosh, B., & Nadeau, D. 2006, ApJ, 641, 556 [Google Scholar]
- Martin, R. G. & Lubow, S. H. 2017, ApJ, 835, L28 [NASA ADS] [CrossRef] [Google Scholar]
- Mawet, D., Absil, O., Delacroix, C., et al. 2013, A&A, 552, L13 [NASA ADS] [CrossRef] [EDP Sciences] [Google Scholar]
- Mawet, D., Milli, J., Wahhaj, Z., et al. 2014, ApJ, 792, 97 [NASA ADS] [CrossRef] [Google Scholar]
- Mawet, D., Choquet, É., Absil, O., et al. 2017, AJ, 153, 44 [NASA ADS] [CrossRef] [Google Scholar]
- Meeus, G., Montesinos, B., Mendigutía, I., et al. 2012, A&A, 544, A78 [NASA ADS] [CrossRef] [EDP Sciences] [Google Scholar]
- Milli, J., Mouillet, D., Lagrange, A.-M., et al. 2012, A&A, 545, A111 [NASA ADS] [CrossRef] [EDP Sciences] [Google Scholar]
- Montesinos, M., Perez, S., Casassus, S., et al. 2016, ApJ, 823, L8 [NASA ADS] [CrossRef] [Google Scholar]
- Nielsen, E. L., De Rosa, R. J., Rameau, J., et al. 2017, AJ, 154, 218 [Google Scholar]
- Owen, J. E. & Lai, D. 2017, MNRAS, 469, 2834 [NASA ADS] [CrossRef] [Google Scholar]
- Paardekooper,S.-J. & Mellema, G. 2004, A&A, 425, L9 [NASA ADS] [CrossRef] [EDP Sciences] [Google Scholar]
- Perez, S., Dunhill, A., Casassus, S., et al. 2015, ApJ, 811, L5 [NASA ADS] [CrossRef] [Google Scholar]
- Pinilla, P., Benisty, M., & Birnstiel, T. 2012a, A&A, 545, A81 [NASA ADS] [CrossRef] [EDP Sciences] [Google Scholar]
- Pinilla, P., Birnstiel, T., Ricci, L., et al. 2012b, A&A, 538, A114 [NASA ADS] [CrossRef] [EDP Sciences] [Google Scholar]
- Pinilla, P., de Juan Ovelar, M., Ataiee, S., et al. 2015, A&A, 573, A9 [NASA ADS] [CrossRef] [EDP Sciences] [Google Scholar]
- Quanz, S. P., Avenhaus, H., Buenzli, E., et al. 2013, ApJ, 766, L2 [NASA ADS] [CrossRef] [Google Scholar]
- Quillen, A. C., Varnière, P., Minchev, I., & Frank, A. 2005, AJ, 129, 2481 [NASA ADS] [CrossRef] [Google Scholar]
- Rafikov, R. R. 2016, ApJ, 831, 122 [NASA ADS] [CrossRef] [Google Scholar]
- Richert, A. J. W., Lyra, W., Boley, A., Mac Low, M.-M., & Turner, N. 2015, ApJ, 804, 95 [NASA ADS] [CrossRef] [Google Scholar]
- Ruane, G., Mawet, D., Kastner, J., et al. 2017, AJ, 154, 73 [NASA ADS] [CrossRef] [Google Scholar]
- Sallum, S., Follette, K. B., Eisner, J. A., et al. 2015, Nature, 527, 342 [NASA ADS] [CrossRef] [Google Scholar]
- Serabyn, E., Huby, E., Matthews, K., et al. 2017, AJ, 153, 43 [Google Scholar]
- Soummer, R., Pueyo, L., & Larkin, J. 2012, ApJ, 755, L28 [NASA ADS] [CrossRef] [Google Scholar]
- van den Ancker, M. E., de Winter, D., Tjin A Djie, H. R. E. 1998, A&A, 330, 145 [NASA ADS] [Google Scholar]
- van der Marel,N., van Dishoeck E. F., Bruderer, S., et al. 2013, Science, 340, 1199 [NASA ADS] [CrossRef] [PubMed] [Google Scholar]
- van Leeuwen, F. 2007, A&A, 474, 653 [NASA ADS] [CrossRef] [EDP Sciences] [Google Scholar]
- Vigan, A., Bonavita, M., Biller, B., et al. 2017, A&A, 603, A3 [NASA ADS] [CrossRef] [EDP Sciences] [Google Scholar]
- Wahhaj, Z., Liu, M. C., Biller, B. A., et al. 2013, ApJ, 779, 80 [NASA ADS] [CrossRef] [Google Scholar]
- Zhu, Z. 2015, ApJ, 799, 16 [NASA ADS] [CrossRef] [Google Scholar]
- Zhu, Z., Dong, R., Stone, J. M., & Rafikov, R. R. 2015, ApJ, 813, 88 [NASA ADS] [CrossRef] [Google Scholar]
All Tables
All Figures
|
Fig. 2 S/N maps for the 2015 (a) and 2016 (b) data sets. Apart from b, none of the other bright features in the inner part of the disk (inside 0.′′ 2, down to the inner working angle at 0.′′08) is recovered with a S∕N > 3. |
| In the text | |
|
Fig. 3 Detection limits at 95% completeness around MWC 758 for the October 2015 (blue line) and the October 2016 (green line) data sets. A false alarm probability of 1% is allowed in our field of view (see Sect. 3.2). The inner region indicated by the gray area is dominated by the presence of the spirals arms. Outward, our detection limits for the October 2015 data set are close to 5 MJup, according tothe BT-SETTL evolutionary model (Allard et al. 2012). |
| In the text | |
|
Fig. 1 Final PCA-ADI images for the 2015 (a) and 2016 (b) data sets. Three spiral arms and a bright point-like feature are detected in the images. The three spiral arms and the point-like source are labeled S1, S2, S3, and b, respectively. |
| In the text | |
|
Fig. 4 Deprojected disk image from the 2015 data set showing the trace of S1 (white), S2 (black), S3 (blue), and features i (green) and ii (cyan). The dotted circles have 40 au and 63 au radial separations, and represent the limits within which the separation angle is computed between each pair of spirals (Fig. 7). |
| In the text | |
|
Fig. 5 Pitch angle of each spiral, in the non-deprojected (top) and deprojected image (bottom). For each measurement, we considered either the whole trace (for S1, features i and ii), or consecutive arcs subtending 50° (for S2 and S3) to trace the evolution of the pitch angle along the trace in order to provide reliable pitch angle estimates. The estimate for feature ii has a larger uncertainty because its trace only subtends ~ 25°, instead of ~ 50° for S1 and feature ii. |
| In the text | |
|
Fig. 6 Circumplanetary disk accretion models from Zhu (2015). The product of the mass of the planet and the disk
accretion rate (MpṀ)
changes as a function of the disk inner radius (Rin).
The solid blue and green lines represent the MpṀ vs. Rin
curve for the measured L′-band
absolute magnitude ( |
| In the text | |
|
Fig. 7 Separation angle between S1 and S2 (solid line), between S1 and S3 (dashed line), and between S2 and S3 (dotted line). |
| In the text | |
|
Fig. B.1 ADI and RDI comparison on artificial spirals. The top and bottom rows show the results of PCA-ADI and PCA-RDI, respectively, on artificially injected spirals. The injected spiral flux increases from left to right. |
| In the text | |
|
Fig. C.1 Wide-field view of MWC 758 from our L′-band 2015 data. Asource is detected at 2.′′3 from the star. Positions of the same object in the 2000 (Grady et al. 2005) and 2005 (Grady et al. 2013) HST observationsare plotted on the image, too. North is up and east is toward the left. |
| In the text | |
Current usage metrics show cumulative count of Article Views (full-text article views including HTML views, PDF and ePub downloads, according to the available data) and Abstracts Views on Vision4Press platform.
Data correspond to usage on the plateform after 2015. The current usage metrics is available 48-96 hours after online publication and is updated daily on week days.
Initial download of the metrics may take a while.