Free Access
Fig. 4
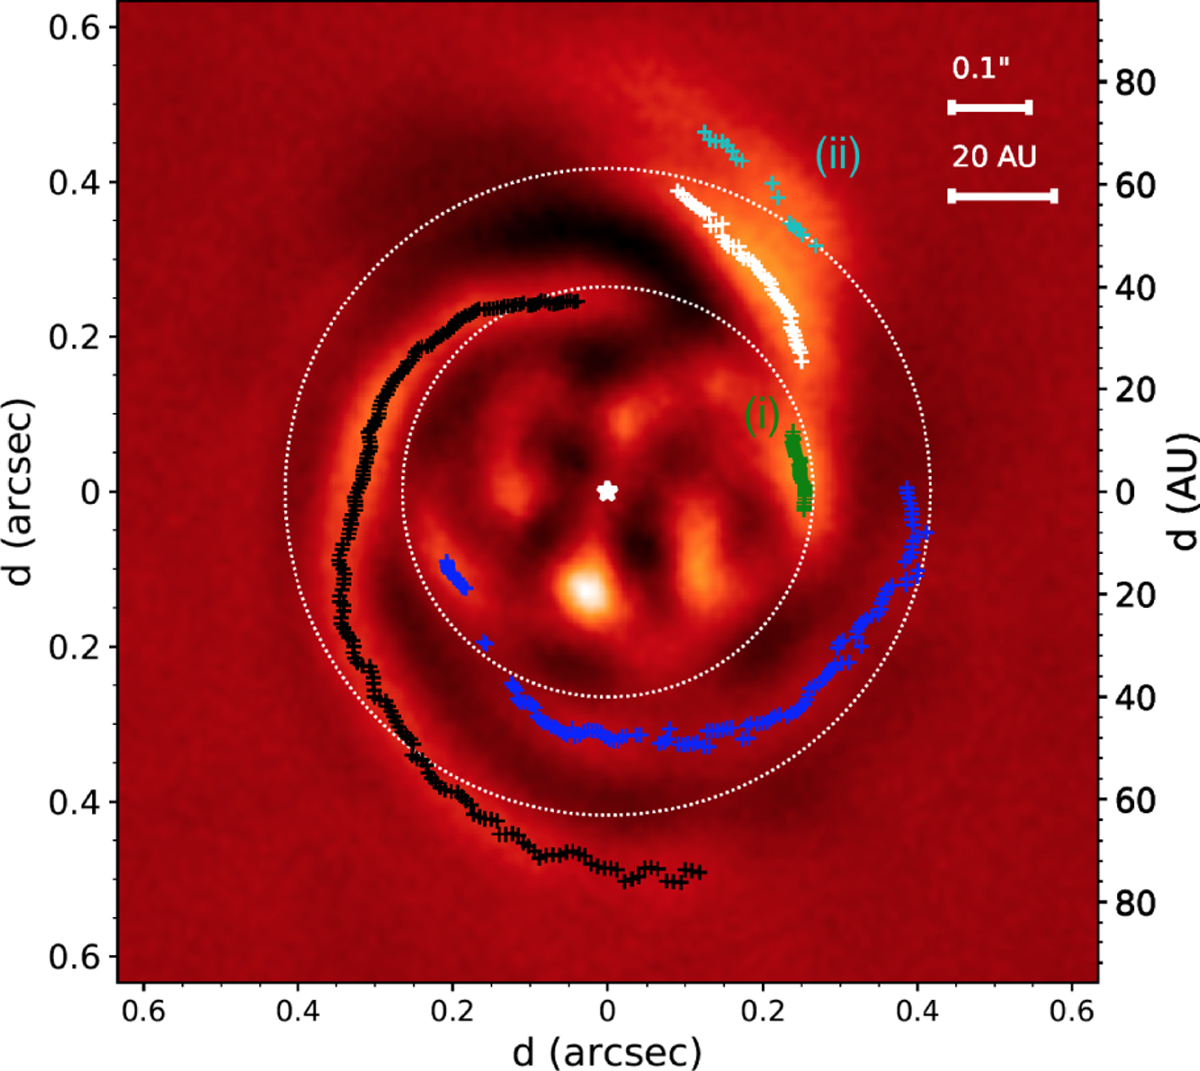
Deprojected disk image from the 2015 data set showing the trace of S1 (white), S2 (black), S3 (blue), and features i (green) and ii (cyan). The dotted circles have 40 au and 63 au radial separations, and represent the limits within which the separation angle is computed between each pair of spirals (Fig. 7).
Current usage metrics show cumulative count of Article Views (full-text article views including HTML views, PDF and ePub downloads, according to the available data) and Abstracts Views on Vision4Press platform.
Data correspond to usage on the plateform after 2015. The current usage metrics is available 48-96 hours after online publication and is updated daily on week days.
Initial download of the metrics may take a while.