Fig. 3
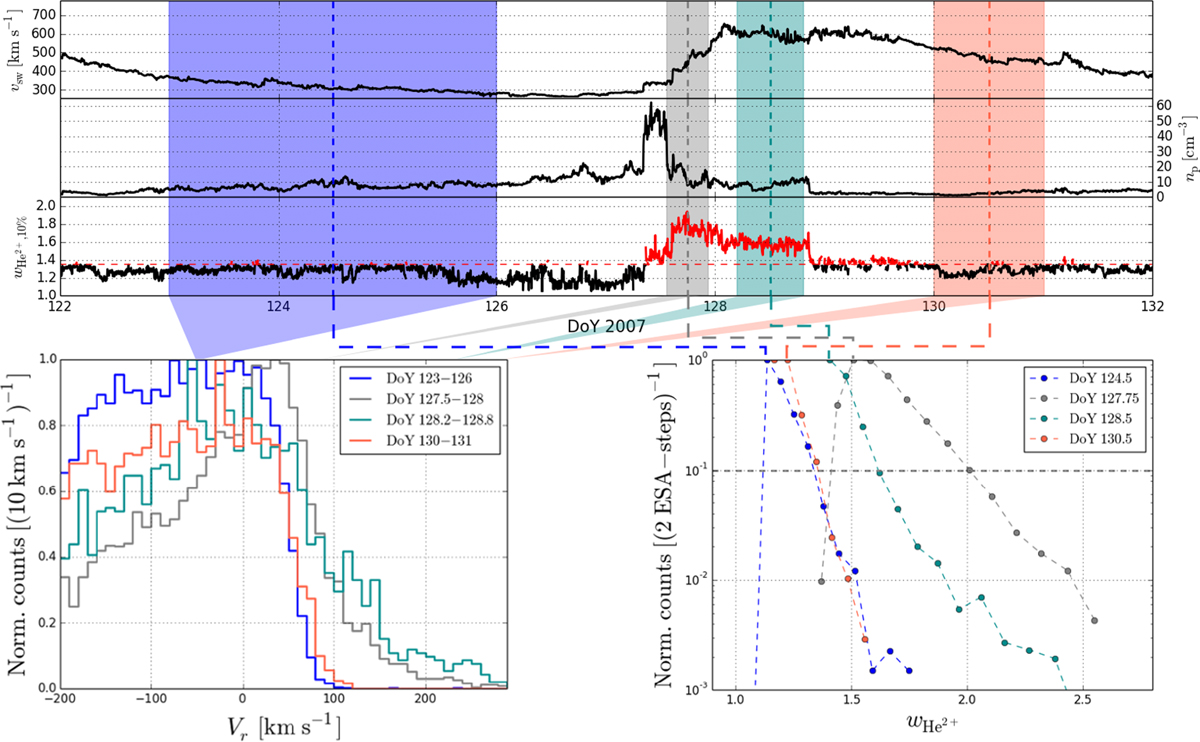
Upper panel: solar wind speed, proton density, and the parameter ![]() derived from the He2+
VDF. Four time periods are marked that correspond to quiet solar wind (blue and red), compressed wind after the
stream interface (gray), and compressed fast wind (cyan). Time periods that are displayed with the red solid line in the
derived from the He2+
VDF. Four time periods are marked that correspond to quiet solar wind (blue and red), compressed wind after the
stream interface (gray), and compressed fast wind (cyan). Time periods that are displayed with the red solid line in the
![]() panel are excluded from our analysis. Lower left panel: He+
count histograms measured in the marked time periods. Lower right panel:
He2+
VDF measured by the sensor’s main channel in one 5 min interval within the considered time periods.
panel are excluded from our analysis. Lower left panel: He+
count histograms measured in the marked time periods. Lower right panel:
He2+
VDF measured by the sensor’s main channel in one 5 min interval within the considered time periods.
Current usage metrics show cumulative count of Article Views (full-text article views including HTML views, PDF and ePub downloads, according to the available data) and Abstracts Views on Vision4Press platform.
Data correspond to usage on the plateform after 2015. The current usage metrics is available 48-96 hours after online publication and is updated daily on week days.
Initial download of the metrics may take a while.