Fig. 9
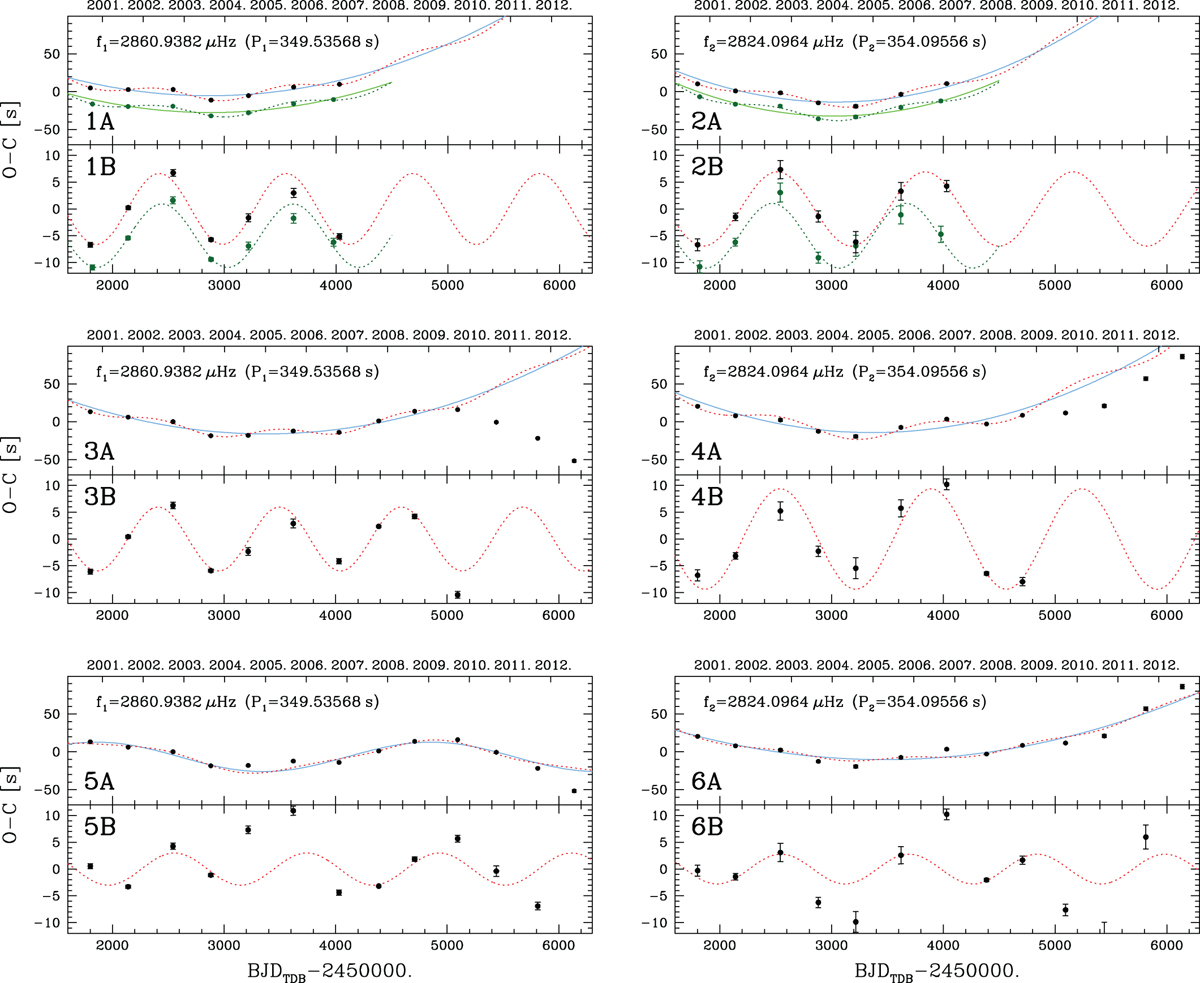
Same as Fig. 8 for f1 (left) and f2 (right) for one-season runs. Panels 1A, 1B, 2A, and 2B are obtained using only the data up to 2007.0, so that we can directly compare the current results (blue and red lines) with those obtained by SSJ07 (green lines shifted by −20 and −5 s in panels 1A and 2A and 1B and 2B, respectively). The small horizontal shifts of the first and last points are due to the addition of three observing runs that were not present in SSJ07. Panels 1B and 2B show that in the current results, the period of the sinusoid is slightly shorter for f1 but longer for f2, so that at the end the agreement between f1 and f2 is worse with respect to SSJ07. The reasons of these differences are discussed in the text. When we add the new data, the longer period of the sinusoidal component of f2 with respect to f1 is confirmed (panels 3B and 4B), and moreover, we note a further difference in amplitude. Panel 3A confirms the change of regime of f1 near 2009 that was already visible in Figs. 7 and 8. This change also tends to worsen the fit of f2 (4A), and for this reason, the fits shown in panels 3A to 4B are obtained considering only the data up to 2009.0. Panels 5A and 5B show an alternative solution obtained using a low-frequency sine wave for the long-term component of f1, as in the lower panels of Fig. 8. The fits shown in panels 5A to 6B were obtained using all the available data. More comments are given in the text.
Current usage metrics show cumulative count of Article Views (full-text article views including HTML views, PDF and ePub downloads, according to the available data) and Abstracts Views on Vision4Press platform.
Data correspond to usage on the plateform after 2015. The current usage metrics is available 48-96 hours after online publication and is updated daily on week days.
Initial download of the metrics may take a while.