Fig. 8
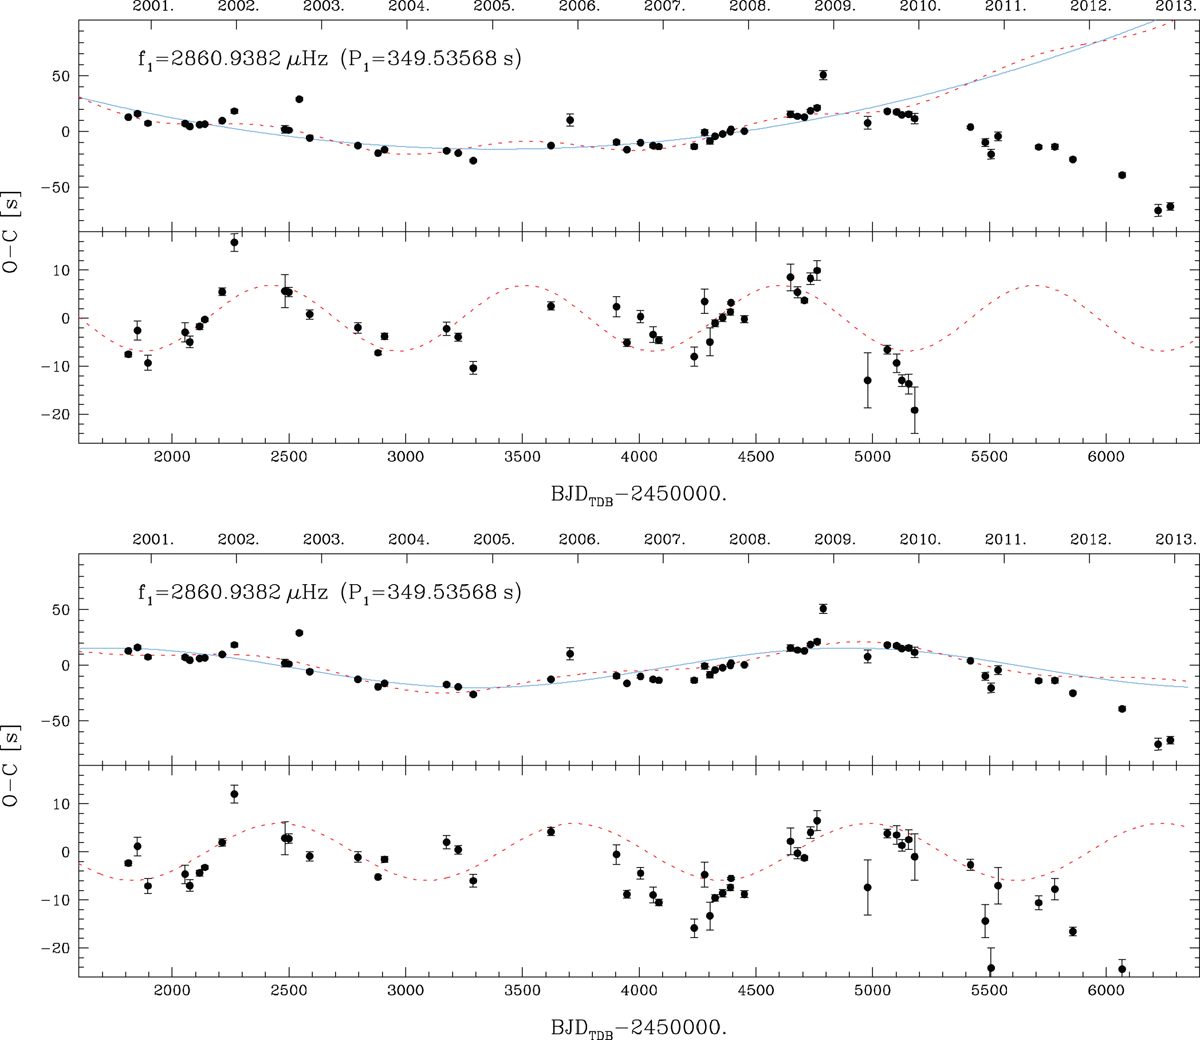
O–C diagram of the main pulsation mode of V391 Peg when using monthly runs (each point represents the data collected within one month). Upper panels: fit of the O–C data with a parabola (long-term variation, blue continuous line) plus a sine wave (“planetary component”, red dashed line) and planetary component alone after subtracting the long-term component. This solution gives satisfactory results only up to the end of 2008, and the fit was made considering only the data up to 2009.0. Lower panels: same as upper panels, but using two sinusoids. In this case, the fit was made using all the data, but a reasonable fit is obtained only up to ~2010, indicating that two components are simply not enough to obtain a reasonable fit of all the data. When we compare the planetary component alone in the period 2000–2009.0, the fit is better when we use parabola + sine wave (χ2 = 762) with respect to the double sine wave (χ2 = 1267); for comparison, a straight line would give χ2 = 1376.
Current usage metrics show cumulative count of Article Views (full-text article views including HTML views, PDF and ePub downloads, according to the available data) and Abstracts Views on Vision4Press platform.
Data correspond to usage on the plateform after 2015. The current usage metrics is available 48-96 hours after online publication and is updated daily on week days.
Initial download of the metrics may take a while.