Fig. 6
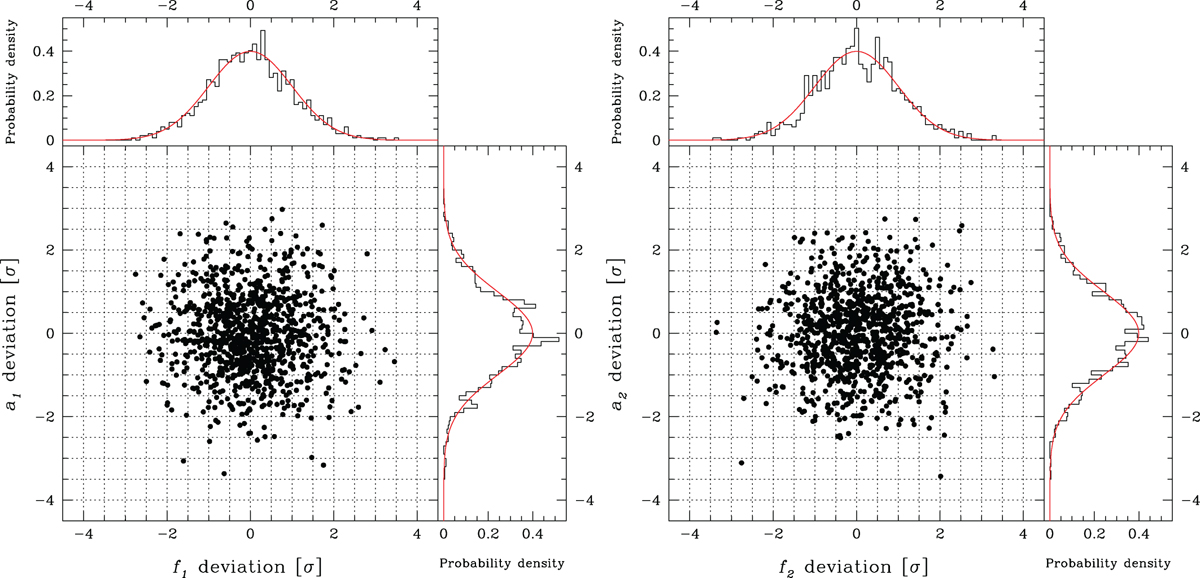
Distribution of the frequency and amplitude deviations for the two main pulsation modes of V391 Peg. The deviations, in units of 1σ errors, are the differences between the values obtained from the original light curve and those obtained from 1000 artificial light curves created by the MC simulator of Period04 (Lenz & Breger 2005). The synthetic light curves are built using the five p-modes of Table 3 and adding Gaussian noise at the same level as the original data. The 2D distributions are also projected into 1D histograms and compared with a normal distribution (red).
Current usage metrics show cumulative count of Article Views (full-text article views including HTML views, PDF and ePub downloads, according to the available data) and Abstracts Views on Vision4Press platform.
Data correspond to usage on the plateform after 2015. The current usage metrics is available 48-96 hours after online publication and is updated daily on week days.
Initial download of the metrics may take a while.