Fig. 5
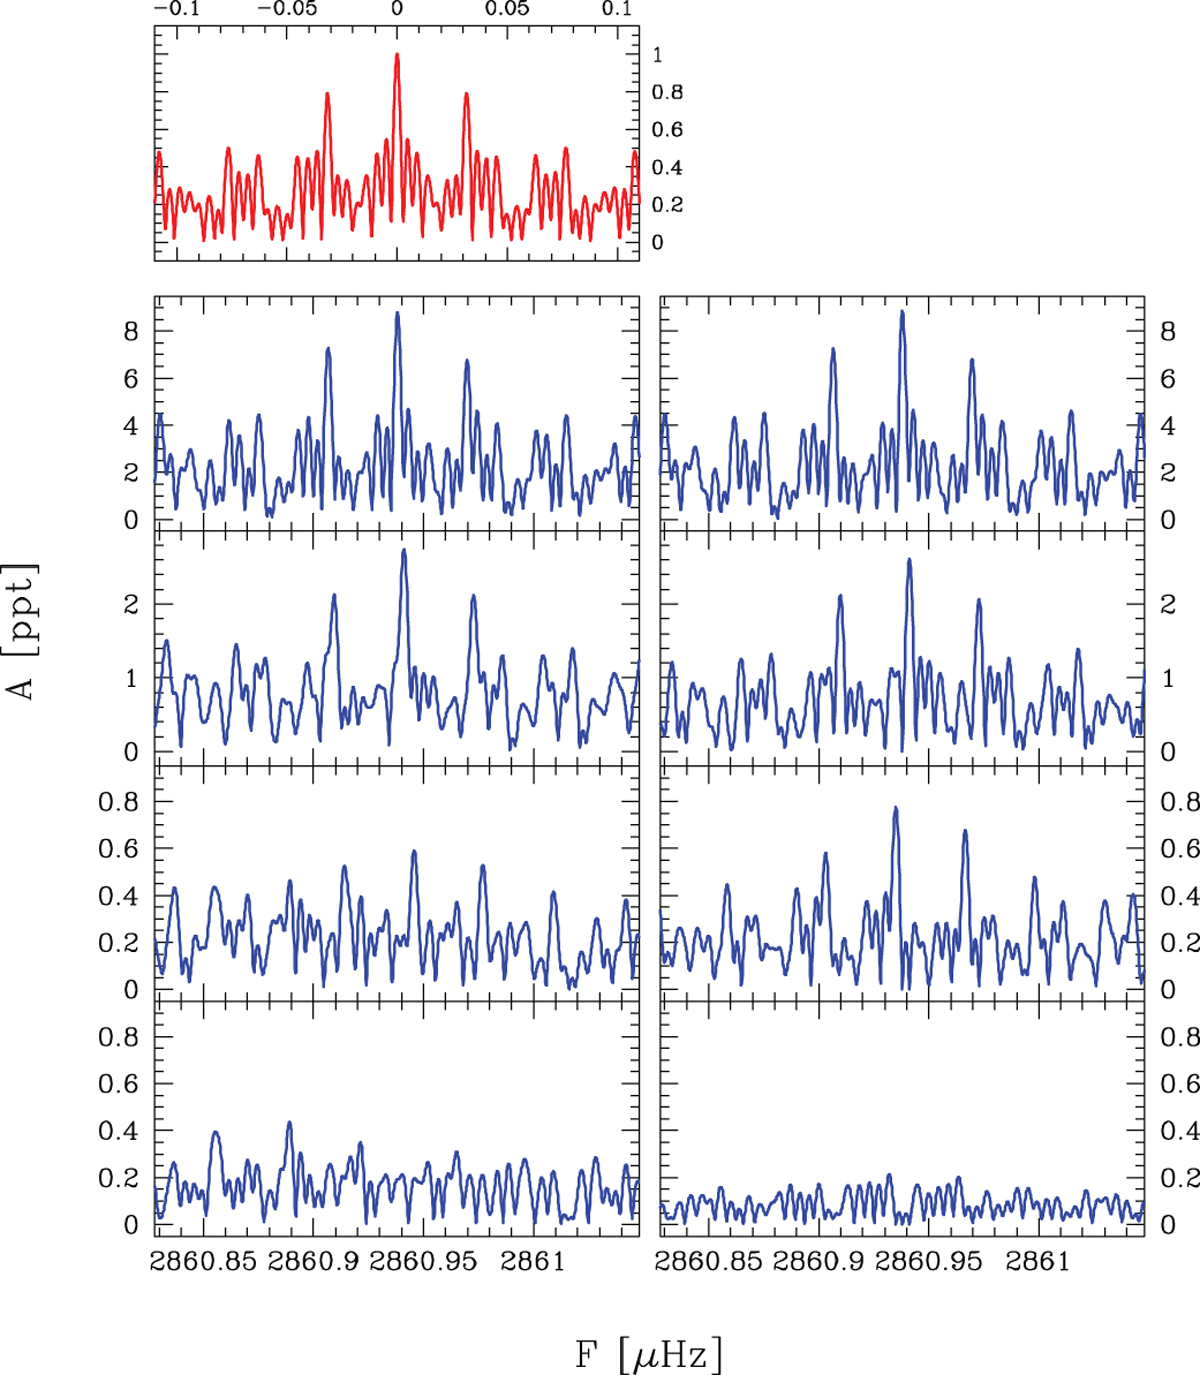
Comparison between the amplitude spectrum near f1
of the data (left) and the amplitude spectrum near f1
of a simulated data set (right) with the same time distribution. In this test we used only
the data up to 2009.0 because in this period it is easier to simulate the behavior of
f1 .
For the simulated data we used a single pure sine wave (no noise) with the same frequency and amplitude of
f1
and also with similar long-term frequency and amplitude variations (linear variation of the period with
![]() = 1.34 × 10⁻¹²,
as derived by the O–C analysis, and sinusoidal variation of the amplitude like in Fig. 7upper right panel, green section). Like in the previous figures, the upper left panel is the normalized
spectral window (red), while the other panels are the amplitude spectra of data and residuals after one, two,
and three prewhitening steps. This simple test shows that up to the secondary peak on the right side of
f1,
the data are well reproduced by the simulation, both in terms of frequency and amplitude. See text for more details.
= 1.34 × 10⁻¹²,
as derived by the O–C analysis, and sinusoidal variation of the amplitude like in Fig. 7upper right panel, green section). Like in the previous figures, the upper left panel is the normalized
spectral window (red), while the other panels are the amplitude spectra of data and residuals after one, two,
and three prewhitening steps. This simple test shows that up to the secondary peak on the right side of
f1,
the data are well reproduced by the simulation, both in terms of frequency and amplitude. See text for more details.
Current usage metrics show cumulative count of Article Views (full-text article views including HTML views, PDF and ePub downloads, according to the available data) and Abstracts Views on Vision4Press platform.
Data correspond to usage on the plateform after 2015. The current usage metrics is available 48-96 hours after online publication and is updated daily on week days.
Initial download of the metrics may take a while.