Fig. 4
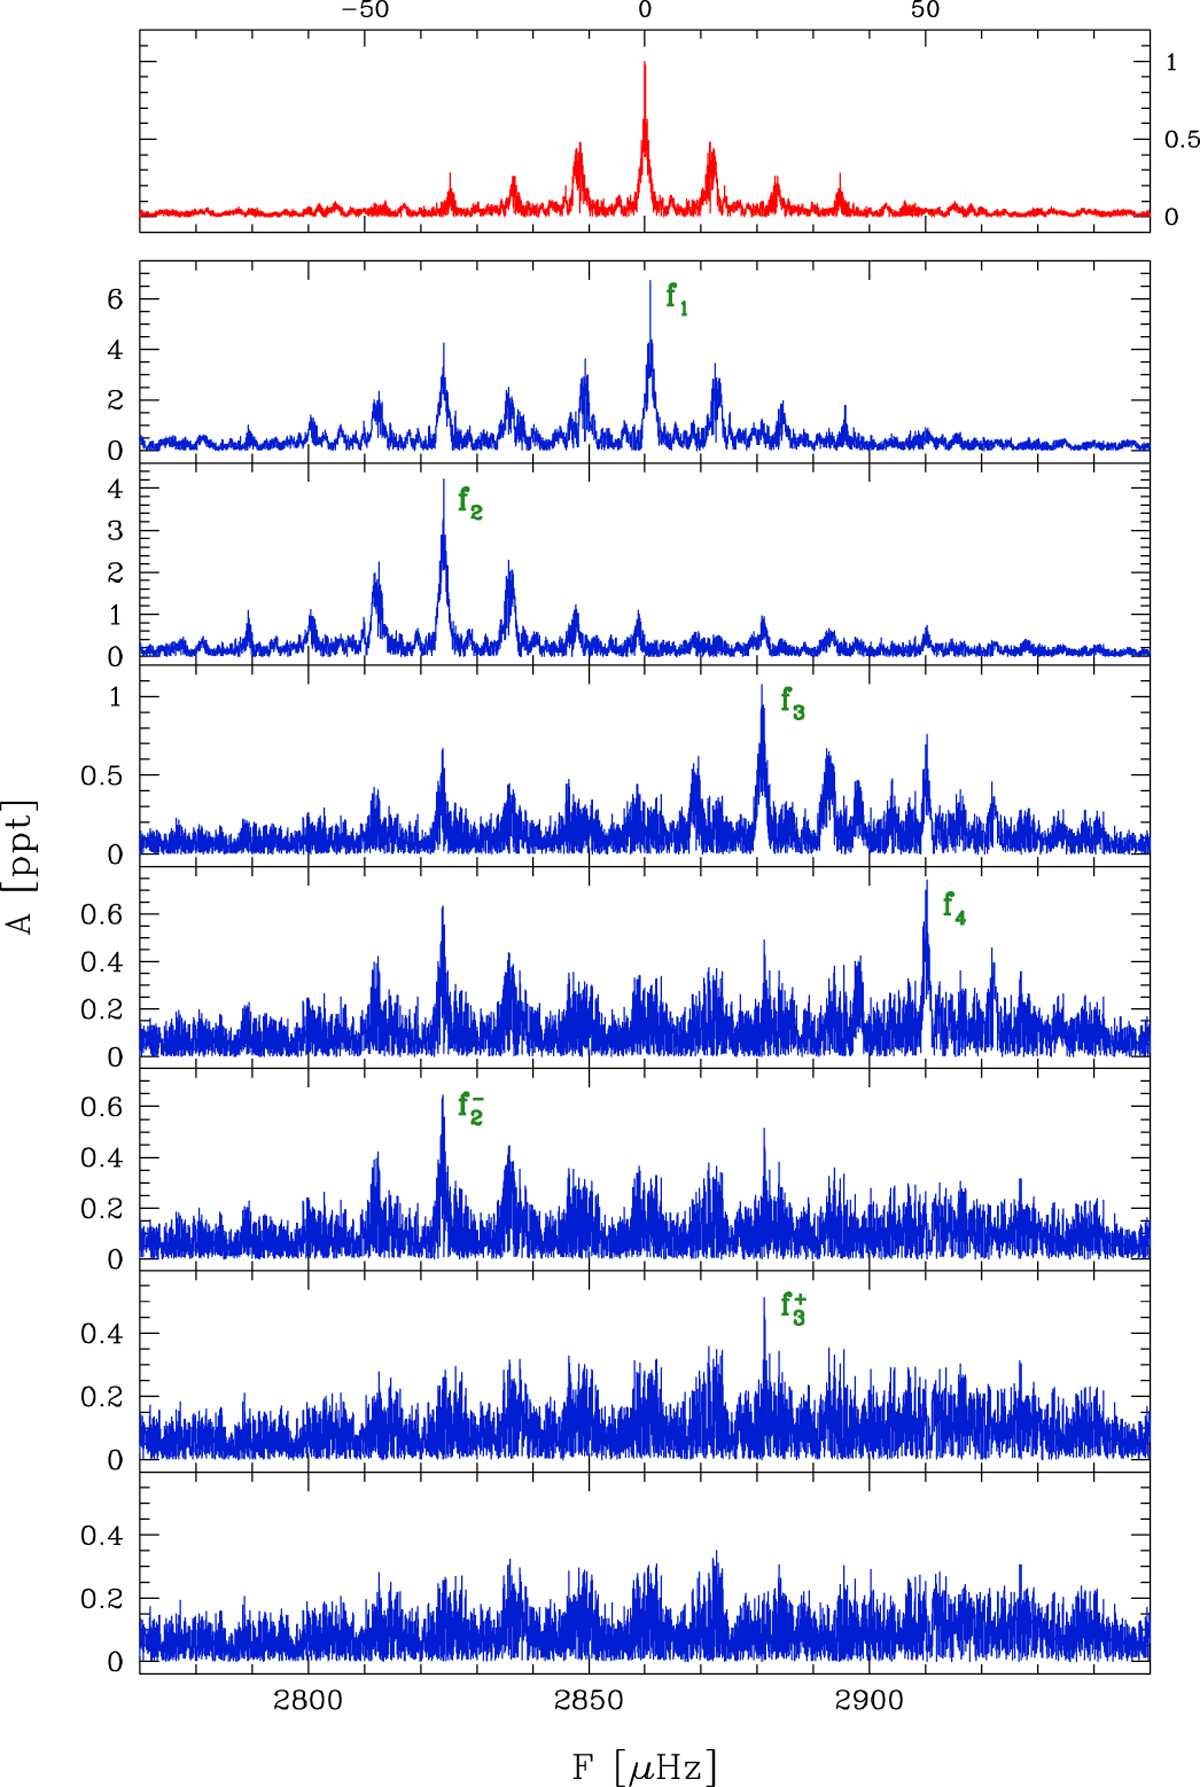
Same as Figs. 2 and 3, but using the whole data set (1999–2012). Upper panels: amplitude spectrum of the data and of the residuals (on the same vertical scale) after subtracting the four main pulsation frequencies (f1 to f4). We note that the residual power is significantly higher than in Fig. 3. The small box shows the normalized spectral window (red) with the one-day aliases at ±11.57 μHz. Lower panels (from top to bottom): normalized spectral window (red) with the 1-year aliases at ±31.7 nHz, and details of the amplitude spectrum of data and residuals near f1 (left) and f2 (right). The horizontal scale in the left and right panels is the same. Two vertical dashed lines (green) highlight two components of a possible rotational splitting. See text for more details.
Current usage metrics show cumulative count of Article Views (full-text article views including HTML views, PDF and ePub downloads, according to the available data) and Abstracts Views on Vision4Press platform.
Data correspond to usage on the plateform after 2015. The current usage metrics is available 48-96 hours after online publication and is updated daily on week days.
Initial download of the metrics may take a while.