Fig. 2
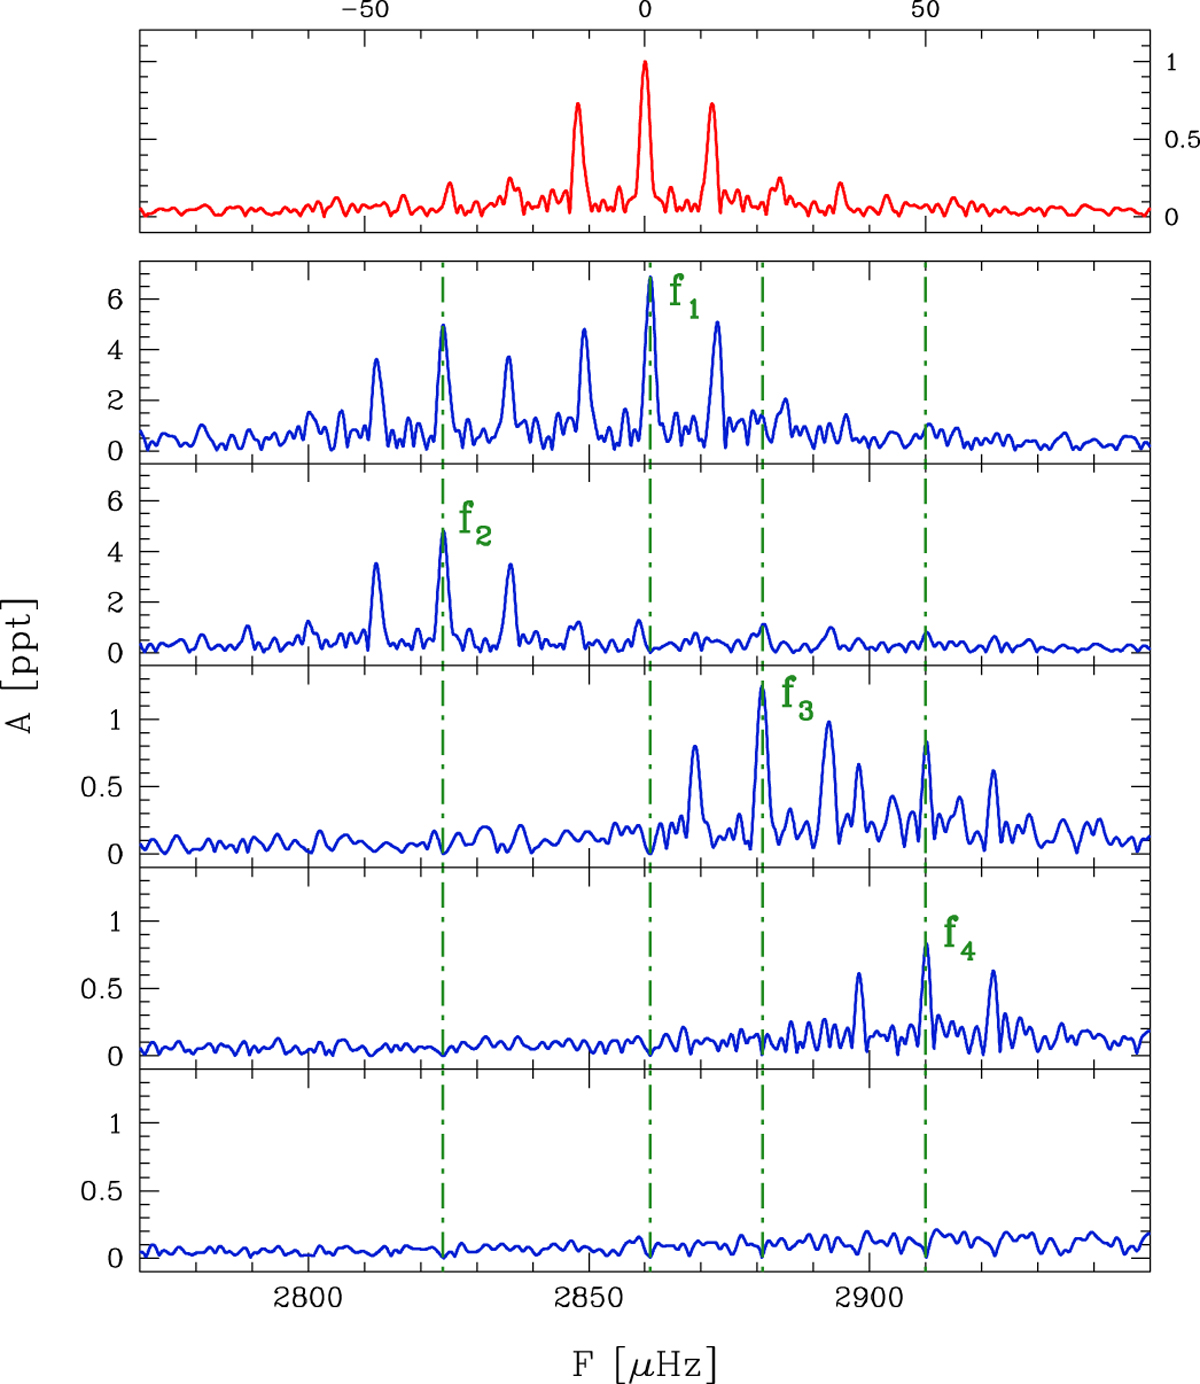
p-mode amplitude spectrum of our best-quality run of 7.9 days, with a duty cycle of 35%, obtained in October 2007 with a SLOAN g filter using two telescopes at different longitudes: the WHT 4.2m in La Palma, equipped with ULTRACAM, and the MDM 1.3m at Kitt Peak. The upper panel shows the spectral window (red), while the other panels from top to bottom show the amplitude spectra of the data and of the residuals after one, two, three, and four prewhitening steps. A plot showing the high quality of the ULTRACAM data is presented in Silvotti et al. (2010).
Current usage metrics show cumulative count of Article Views (full-text article views including HTML views, PDF and ePub downloads, according to the available data) and Abstracts Views on Vision4Press platform.
Data correspond to usage on the plateform after 2015. The current usage metrics is available 48-96 hours after online publication and is updated daily on week days.
Initial download of the metrics may take a while.