Fig. 11
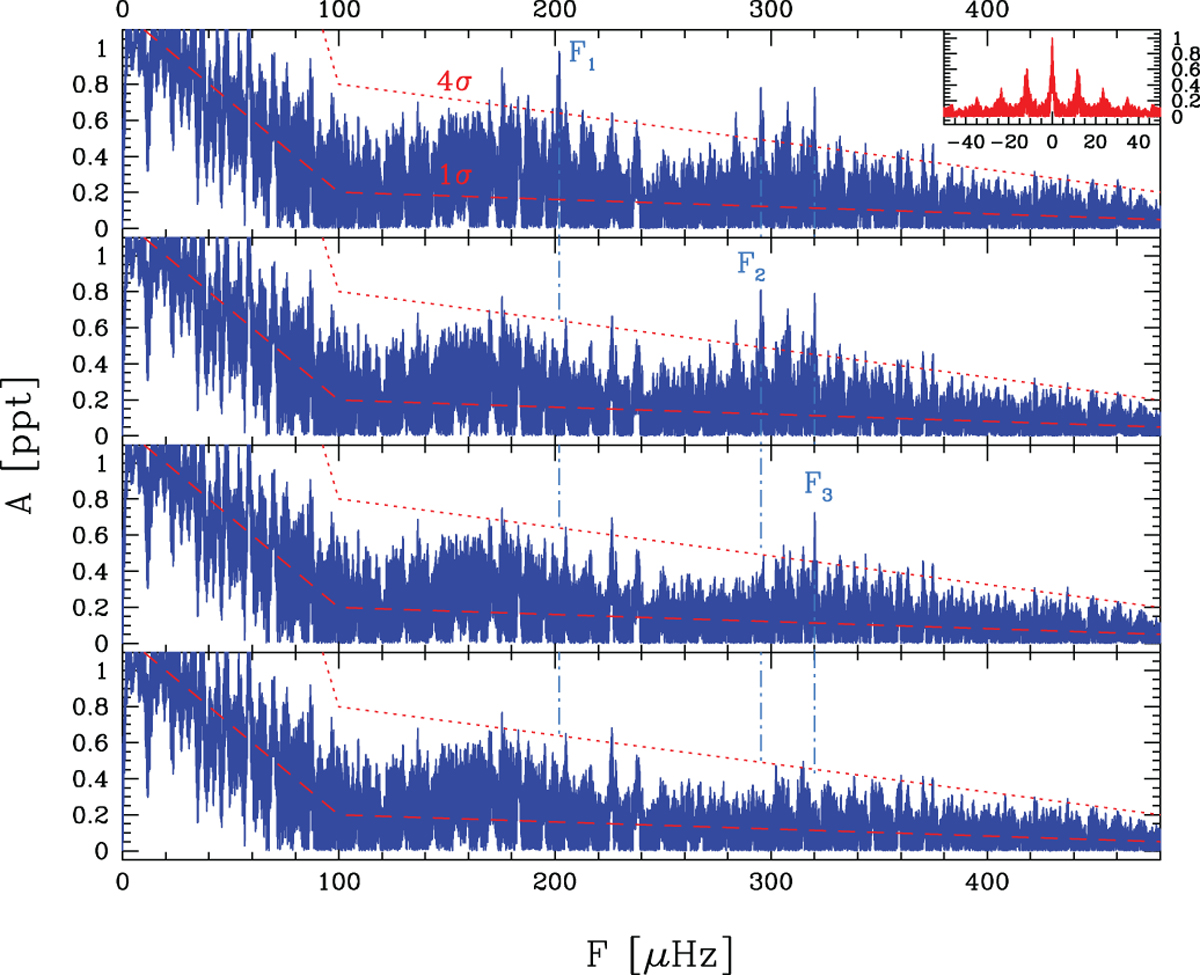
g-mode amplitude spectrum using our best-quality runs between 2002 and 2008 (192.8 h of observations in total). The upper right panel shows the spectral window (red), while the other panels from top to bottom show amplitude spectrum and residuals after one, two, and three prewhitening steps. We note an excess of power in two main regions near 180 and 310 μHz. After prewhitening, this excess of power is not completely removed near 180 μHz, suggesting that further low-amplitude frequencies are present in that region.
Current usage metrics show cumulative count of Article Views (full-text article views including HTML views, PDF and ePub downloads, according to the available data) and Abstracts Views on Vision4Press platform.
Data correspond to usage on the plateform after 2015. The current usage metrics is available 48-96 hours after online publication and is updated daily on week days.
Initial download of the metrics may take a while.