Fig. 10
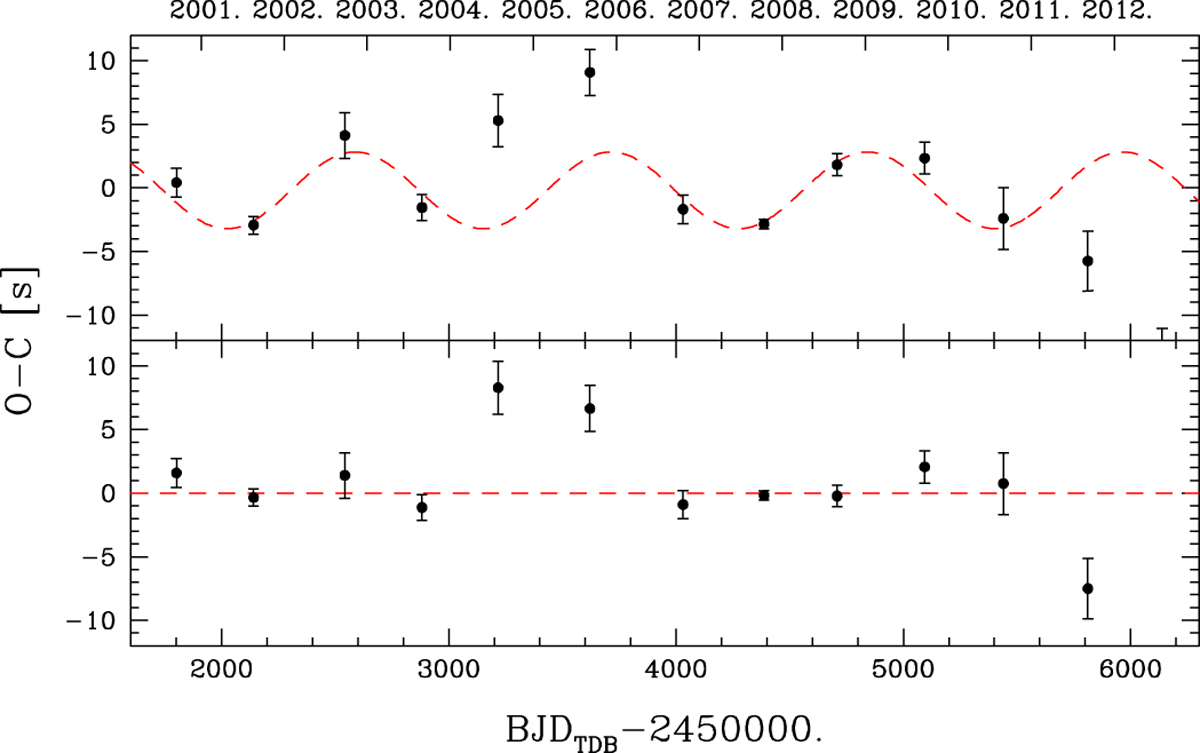
O–C diagram obtained by combining the information from f1 and f2 . In practice, we have computed the weighted average of the points in panels 5B and 6B of Fig. 9 and recomputed the best fit with a sine wave. Compared with these panels, the fit is significantly improved and the residuals of 9 points out of 13 (including all those with smaller error bars) are close to zero.
Current usage metrics show cumulative count of Article Views (full-text article views including HTML views, PDF and ePub downloads, according to the available data) and Abstracts Views on Vision4Press platform.
Data correspond to usage on the plateform after 2015. The current usage metrics is available 48-96 hours after online publication and is updated daily on week days.
Initial download of the metrics may take a while.