Free Access
Fig. 1
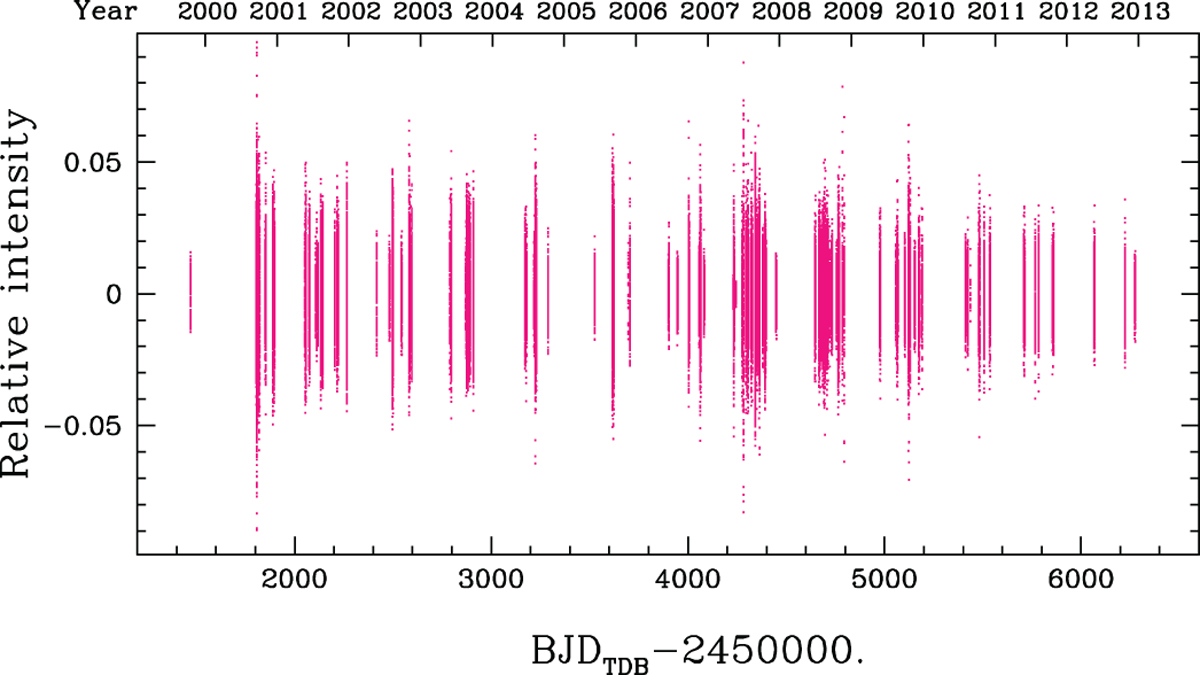
Distribution of the 217 232 data points over 13 years. The overall duty cycle is 0.92%, and the best coverage is obtained in 2007 with a duty cycle of 5.55%. The varying relative intensity is caused by the beating between the main frequencies and also depends on the varying quality of the data.
Current usage metrics show cumulative count of Article Views (full-text article views including HTML views, PDF and ePub downloads, according to the available data) and Abstracts Views on Vision4Press platform.
Data correspond to usage on the plateform after 2015. The current usage metrics is available 48-96 hours after online publication and is updated daily on week days.
Initial download of the metrics may take a while.