Fig. 1
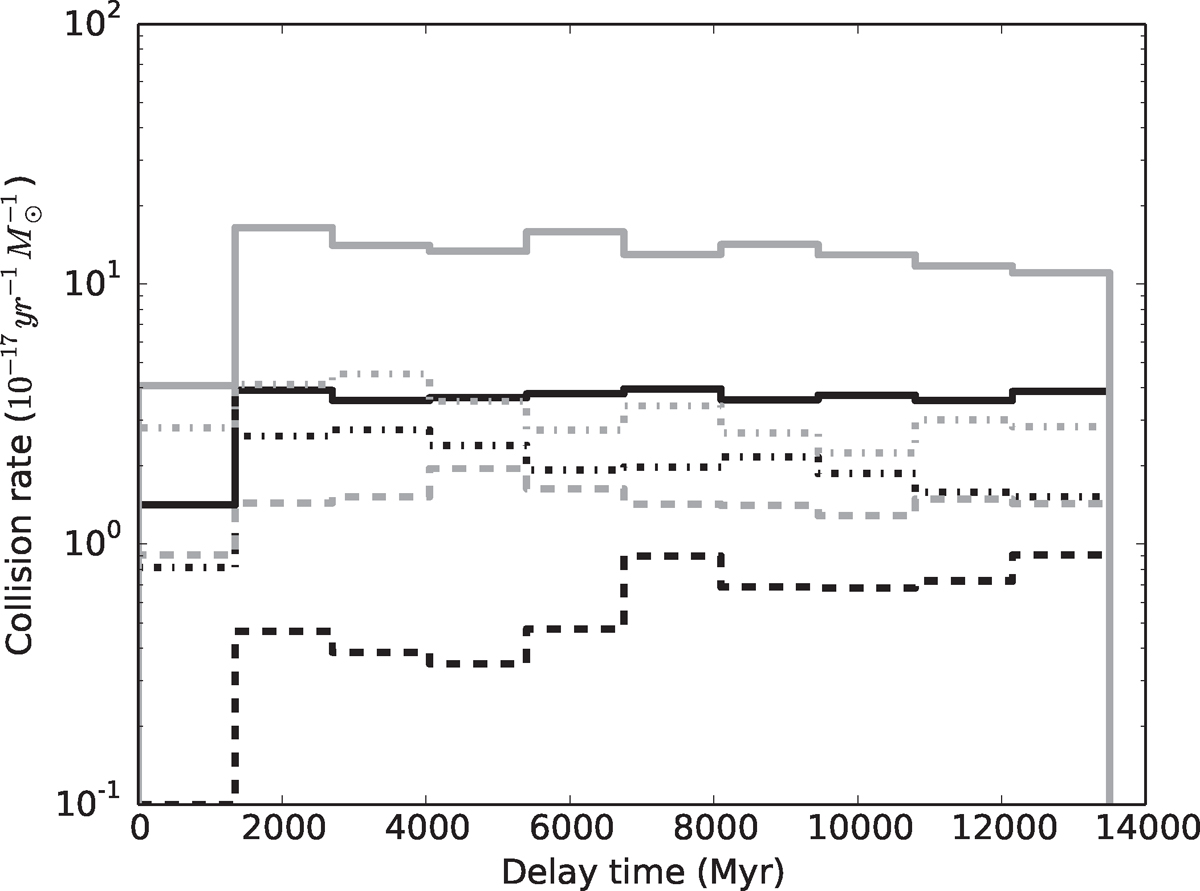
Delay time distribution of head-on collisions between white dwarfs in isolated triples. The rate of collisions is given per 1017 yr per solar mass of created stars. The different line-styles correspond to the different models in method 2. The DTD is approximately uniform in time. Both the normalization and the shape of the DTD is in clear contradiction with observations.
Current usage metrics show cumulative count of Article Views (full-text article views including HTML views, PDF and ePub downloads, according to the available data) and Abstracts Views on Vision4Press platform.
Data correspond to usage on the plateform after 2015. The current usage metrics is available 48-96 hours after online publication and is updated daily on week days.
Initial download of the metrics may take a while.