| Issue |
A&A
Volume 609, January 2018
|
|
|---|---|---|
| Article Number | L1 | |
| Number of page(s) | 4 | |
| Section | Letters to the Editor | |
| DOI | https://doi.org/10.1051/0004-6361/201732188 | |
| Published online | 29 January 2018 | |
Letter to the Editor
Planetary nebulae with UVIT: Far ultra-violet halo around the Bow Tie nebula (NGC 40)★
1
Indian Institute of Astrophysics,
Koramangala II Block,
Bangalore
560034, India
e-mail: This email address is being protected from spambots. You need JavaScript enabled to view it.
2
Tata Institute of Fundamental Research,
Colaba,
Mumbai
400005, India
3
Homi Bhabha Centre for Science Education (TIFR),
Mumbai
400088, India
Received:
27
October
2017
Accepted:
17
November
2017
Abstract
Context. NGC 40 is a planetary nebula with diffuse X-ray emission, suggesting an interaction of the high-speed wind from WC8 central star (CS) with the nebula. It shows strong C IV 1550 Å emission that cannot be explained by thermal processes alone. We present here the first map of this nebula in C IV emission using broad band filters on the Ultra-Violet Imaging Telescope (UVIT).
Aim. We aim to map the hot C IV-emitting gas and its correspondence with soft X-ray (0.3–8 keV) emitting regions in order to study the shock interaction between the nebula and the ISM. We also aim to illustrate the potential of UVIT for nebular studies.
Methods. We carry out a morphological study of images of the nebula obtained at an angular resolution of about 1.3″ in four UVIT filter bands that include C IV 1550 Å and [C II] 2326 Å lines as well as UV continuum. We also make comparisons with X-ray, optical, and IR images from the literature.
Results. The [C II] 2326 Å images show the core of the nebula with two lobes on either side of CS similar to [N II]. The C IV emission in the core shows similar morphology and extent to that of diffuse X-ray emission concentrated in nebular condensations. A surprising UVIT discovery is the presence of a large faint far UV (FUV) halo in an FUV filter with λeff of 1608 Å. The UV halo is not present in any other UV filter. The FUV halo is most likely due to UV fluorescence emission from the Lyman bands of H2 molecules. Unlike the optical and IR halo, the FUV halo trails predominantly towards the south-east side of the nebular core, opposite to the CS’s proper motion direction.
Conclusions. Morphological similarity of C IV 1550 Å and X-ray emission in the core suggests that it results mostly from the interaction of strong CS wind with the nebula. The FUV halo in NGC 40 highlights the extensive existence of H2 molecules in the regions even beyond the optical and IR halos. Thus UV studies are important to estimate the amount of H2, which is probably the most dominant molecule and significant for mass-loss studies.
Key words: ISM: lines and bands / planetary nebulae: individual: NGC 40 / ultraviolet: ISM
Based on data obtained with the Ultra-Violet Imaging Telescope (UVIT) on the ASTROSAT satellite.
© ESO, 2018
1 Introduction
The Bow Tie nebula (NGC 40, PN G357.4-07.2) is a low-excitation planetary nebula with a Wolf–Rayet central star (CS) of WC8 type that blows a strong high-velocity stellar wind of 1730 km s−1 (Feibelman 1999) into a mildly expanding nebula. The star is hydrogen deficient, carbon rich, and has Teff of 71 kK (Marcolino et al. 2007) with a high mass-loss rate of about 10−5 to 10−6 M⊙ yr−1 (Bianchi 1992). It has been suggested that the hot CS is shielded by a carbon curtain which lowers the level of ionization in the nebula (Bianchi & Grewing 1987).
NGC 40 is a well studied nebula in all wavelengths. Morphological studies in the optical and IR show that the nebula has a central core of about 48″ in diameter, which is described as cylindrical or barrel-like in the IR and in low-excitation lines such as [N II] 6583 Å, with two lobes on slightly south-east and north-west sides to the central star, the latter lobe being brighter. In high-excitation lines such as [O III] 5007 Å the central core is elliptical or almost circular with maximum emission within the [N II] 6583 Å zone (Meaburn et al. 1996; Ramos-Larios et al. 2011). The core is surrounded by two faint halos that are seen only in deep images in low-excitation lines and in IR but not in high-excitation lines such as [O III] 5007 Å. The smooth inner halo might extend from 48″ to 90″ in diameter, whereas the outer halo, which is filamentary and patchy, might extend to a diameter of 4 arcminutes surrounding the star (see Meaburn et al. 1996, for a sketch). A prominent filament, bright in Hα + [N II], exists on the north-east of the core. It has been shown by deep monochromatic images in Hα + [N II] and in IR using unsharp masking techniques that the halo contains several almost circular rings of emission surrounding the central star and the nebular core with spacings of 5″ to 7″ (Corradi et al. 2004; Ramos-Larios et al. 2011), a remnant of the asymptotic giant branch (AGB) wind of earlier evolution. The IR imagery also shows that there are emission spokes almost radial to the core present in the halo. The ISO and Spitzer spectra of the nebula show that it has 90 to 150 K cool dust, polycyclic aromatic hydrocarbon (PAH) features as well as some low-ionization ionic lines (Ramos-Larios et al. 2011). Martin et al. (2002) interpreted the bright filament in the north-east and other filaments and tongues as a result of the interaction of the nebula as it moves in the interstellar medium (ISM).
The discovery of diffuse soft X-ray emission from NGC 40 confirmed the interaction of the fast stellar wind with slow-moving AGB envelope (Montez et al. 2005). This emission arises from a hot bubble created by quasi-spherical fast wind shock and is distributed in an annulus inside the nebular core (Fig. 3, left, blue patches) in patches that are not completely filled in.
Several authors (Clegg et al. 1983; Pottasch et al. 2003; Zhang & Liu 2005) have analysed the optical and UV spectra (from International Ultraviolet Explorer [IUE]) and have shown that the nebula is rich in carbon as well as in 19F, strongly suggesting the mixing of nucleosynthetic products from AGB into the nebula.
Clegg et al. (1983), from their UV spectrum, point out that the C IV 1550 Å emission is too strong in comparison with other low-excitation nebulae and is unlikely to have been produced by thermal processes alone. They suggest it could be related to the strong stellar wind. This is one of the aspects, along with the desire to map the hot gas and its location with respect to X-ray emitting regions, that prompted us to observe NGC 40 with UVIT. One of the far-UV (FUV) filters allows strong C IV 1550 Å, He II 1640 Å, and O III emission lines (Feibelman 1999) and another filter admits the neighbouring continuum (Fig. 1). NGC 40 is one of the first planetary nebulae to be imaged with UVIT. We present our results including the surprising discovery of an FUV halo in this paper.
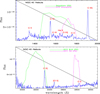 |
Fig. 1 IUE low-resolution nebular spectrum of NGC 40 (blue line) obtained at 6″ north and 13″ west of the central star. FUV and NUV are plotted at the top and bottom, respectively, with UVIT-filter effective areas (relative) shown. In the top panel, green denotes F169M FUV Sapphire and magenta denotes F172M FUV Silica, and in the bottom panel, green is N219M NUV B15 and magenta is N279N NUV N2. |
2 Observations
UVIT is one of the payloads on the Indian astronomical satellite ASTROSAT that was launched on 2015 September 28. It consists of twin telescopes of 38 cm aperture each. One of them is optimised for FUV and the other for near UV (NUV) and optical: a dichroic mirror reflects the NUV and transmits the optical light. It operates in three channels: FUV, NUV, and optical simultaneously, providing a 28 arcmin diameter field with a spatial resolution of about 1.3 arcsec in UV bands. The two UV channels are provided with five filters and a low-resolution transmission grating. The details of the instrument are given in Kumar et al. (2012) and in orbit performance is given in Tandon et al. (2017a).
The instrument was aimed at RA: 00h 13m01.0s, Dec: 72°31′19.1″. The present observations of NGC 40 were obtained on 2016 December 9 in two FUV filters, F169M (Sapphire: λeff of 1608 Å) and F172M (Silica: λeff of 1717 Å) as well as in two NUV filters, N219M (B15: λeff of 2196 Å) and N279N (N2: λeff of 2792 Å). The effective exposure times that went into building the images are 1102 s for F169M FUV Sapphire, 1339 s for F172M FUV Silica, 1294 s for N219M NUV B15, and 1071 s for N279N NUV N2. The stellar images in F169M filter show a PSF of 1.4 arcsec.
In its standard operating mode, UVIT will take images of the sky with a frame rate of 29 s−1 which are stored on board and then sent to the Indian Space Science Data Centre (ISSDC) where the data are written into instrument-specific Level 1 data files. Murthy et al. (2017) has written a set of procedures (JUDE) to read the Level 1 data, extract the photon events from each frame, correct for spacecraft motion (image registration) and add into an image. We used Astrometry.net (Lang et al. 2010) for an astrometric calibration and Rahna et al. (2017) for a photometric calibration. We have co-added the individual images and placed them all on a common reference frame; these were used for our further scientific analysis.
Figure 1 shows the IUE spectrum of NGC 40 nebula with the transmission functions (arbitrary scale) of the filters we used. It is clear that F169M FUV Sapphire allows high-excitation lines of C IV 1550 Å, C III 1576 Å, He II 1640 Å, and O III 1661 Å emission and that F172M FUV Silica allows the continuum and weak C II 1761 Å. Similarly the NUV filter N219M allows C II 2328 Å emission and filter N279N has mostly the continuum although the weak C II 2836 Å might also contribute.
3 Results and discussion
3.1 Morphological description
In Fig. 2 we present UVIT images in all observed filters along with Galex images in NUV and FUV. It is evident that UVIT images provide higher spatial resolution and show structure. The N219M filter essentially displays the monochromatic image in C II 2326 Å emission and the F172M filter shows nebula mostly in continuum at 1717 Å. The Galex FUV image shows an extension towards north-east along the axis of the nebula which is not present in UVIT FUV filters.
C II image (Fig. 2, bottom centre) looks very similar to the low-excitation nebular line images (e.g. [N II]) shown by Meaburn et al. (1996). The barrel-like structure is well seen with two bright lobes on either side of the barrel axis, the west one being brighter. Along the barrel axis two condensations (ansae) are present on either side of the star at a separation of about 32″. The southern condensation is slightly brighter. The extent of the image perpendicular to the barrel axis is about 45″. In contrast, the FUV image, F172M, although similar to C II image, is more filled-in. The lobes are not as prominent but the condensations on either side of the star are more prominent. The FUV F169M image, however, shows a contrasting structure (Fig. 2, top centre); the bright emission region is more elliptical and there are four bright patches of nebulosity with distinct gaps. The southern condensations along the barrel axis are more conspicuous and a nebular loop connects that to the nebula. The size perpendicular to the barrel axis seems to be about 54″; larger than the C II size. From the photoionization modelling (Monteiro & Falceta-Gonçalves 2011) it is expected that C IV, He II, and O III emission zones are smaller than [N II], contrary to what is observed, confirming the statement made by Clegg et al. (1983).
C IV, with its ionization potential of 48 eV, might be the highest-ionized species seen in the spectrum (He II lines are very weak). We compared the F169M core image with the soft X-ray image produced by Montez et al. (2005) in Fig. 31. We show a contoured and enlarged F169M image of the nebular corehighlighting the bright regions. The similarity in the images is obvious. The emission in both X-rays and high-excitation lines exists in patches and both are distributed in an annulus. These emissions seem to follow X-ray emission and thus partly come from shocked regions (the hot bubble). Modelling C IV and X-ray emission together would provide strong constraints to 3D models. It is of interest to note that the low-resolution slit-less FUV grating spectra (Rao et al., in prep.) obtained with UVIT show the C IV 1550 Å nebular emission extending over the core.
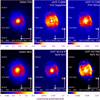 |
Fig. 2 Comparison of Galex images of NGC 40 with UVIT images. We note that the UVIT images provide better resolution and show structure in the nebula. The core of NGC 40 in F169M FUV Sapphire (top middle) is compared with N219M NUV B15 that shows mainly C II 2326 Å emission. C II image is very similar to low-excitation nebular line emissions seen in [S II] or [N II] (Meaburn et al. 1996) whereas F169M image shows several bright nebular condensations (also see Fig. 3). The axes are α and δ. |
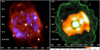 |
Fig. 3 X-ray image (left panel – blue emissions) superposed on Hα image is compared with the contoured F169M FUV Sapphire image (right panel). We note the similarities of the bright condensations of emission in both images and the overall elliptical shape. |
3.2 FUV halo and ISM
A comparison of the F169M FUV Sapphire image with the F172M FUV Silica shows faint halo around the core of the nebula in F169M FUV Sapphire mainly to south-east extending to about 4 arcmin (Fig. 4, top right) from the central star. This halo is not present in any of the other NUV filters, nor in Galex FUV or NUV images. Thus the discovery of a halo in F169M FUV Sapphire is a total surprise, although Galex FUV image shows an extension tonorth-east. A slightly processed image of the halo with contours is shown in Fig. 5.
It is of some interest to see whether the absence of the halo in other UV filters is because of differences in exposure times, band width, and so on. The band widths of F169M, F172M, and N219M are 290, 125, and 270 Å (Tandon et al. 2017b), respectively. The peak flux in the nebular core converted from counts/s to flux using (Tandon et al. 2017b) in flight calibration seem to be similar in F169M and F172M and slightly less in N219M. As Fig. 4 (bottom plot) shows the logarithmic flux plots of the nebula across the core in the three filters, it clearly illustrates the existence of a halo around the nebular core in F169M and its absence in the two filters F172M and N219M. The absence of halo in other UV filters is not due to lack of adequate exposure time or sensitivity.
Two aspects are noteworthy: (1) unlike the optical and IR halos, whichare more or less symmetrical around the core of the nebula (Meaburn et al. 1996), the FUV halo is mainly towards the south-east side of the central star (Fig. 5) and extends to about 4 arcmin from the star. The FUV halo is also filamentary and shows similarity with optical and IR halo features like the bent jet (Martin et al. 2002) and bands denoted as A & B by Ramos-Larios et al. (2011). (2) The axis of the FUV halo seems to point in the direction of the proper motion of the star. Figure 5 (black contours) from Martin et al. (2002) shows the proper motion vector (black arrow).
The source of emission from the FUV halo cannot be the C IV 1550 Å line for the obvious reason that no high excitation line emission including [O III] 5007 Å is seen in the halo (Meaburn et al. 1996; Corradi et al. 2004) or outside of the nebular core. The FUV Grating spectrum (Rao et al., in prep.) also does not show any C IV emission extending to the halo (however this may be due to lack of sensitivity).
The dust scattering of UV photons from the 71 kK central star might not be appropriate since dust (Mie) scattering would be over a broader wavelength range; thus the absence of halo emission in the filter centred at 1717 Å cannot be reconciled. Therefore, the only other possibility for the emission to be present only in the filter centred at 1608 Å seems to be emission in Lyman bands of H2 molecules. Warm H2 from circum-nebular regions has already been detected around many PNs from FUSE spectra (Herald & Bianchi 2004, 2007, 2011; McCandliss et al. 2007). Such H2 emissions have also been seen in reflection nebula IC 63 (Witt et al. 1989), the FUV bright tail of Mira (Martin et al. 2007), FUV rings around carbon star U Hya (Sanchez et al. 2015) and ISM (Martin et al. 1990). Few H2 rotational lines in 2.1–2.4 μm region have been detected in the western lobe of NGC 40 (Hora et al. 1999), however H2 emission was not detected in the narrow band imagery. The spectra produced by a UV fluorescent process in IC 63 (also diffuse ISM) observed and modelled by France et al. (2005) shows strong emission blueward of the 1608 Å peak and no emission longward of 1650 Å. Since the halo is of low excitation, impact excitation by hot electrons of H2 , that is, by shocks, seems unlikely.
Interaction of FUV halo with ISM seems to be strongly present. The halo is mostly on the trailing side of nebular head that is oriented towards the proper motion direction, unlike IR halo. The nebular head is brighter in the direction (Fig. 5) of proper motion, similar to case B of Wareing et al. (2007). The filamentary structure and the direction of the filaments suggests strong interaction of the stellar wind with ISM, as described by Martin et al. (2002).
The novel result presented here is the discovery of FUV halo excited by UV fluorescent H2 molecules around NGC 40. Such extensive presence of H2 is not obvious from IR lines. Extensive FUV halos might not be uncommon around compact PNs as exemplified by NGC 40 and NGC 2440 (Rao et al., in prep.). Imaging in IR H2 lines does not seem to reveal the extent of FUV H2 regions, thus UV observations are important in estimating H2 content in PNs.
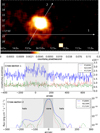 |
Fig. 4 Cross-cuts in the images of the nebula in three filters; F169M (blue), F172M (green), and N219M (red) made along the white lines shown in the slightly smoothed F169M image of the nebula (top). Cross-cuts of 8 pixel widths were obtained in all the images at the same locations (coordinates). The bottom cross-cut, which passes through the nebular core, is on a logarithmic scale and has been smoothed. We note the faint quasi-circular extended halo around the core of the nebula (on the south-east side). This region has been shown with a grey overlay in the plots. Despite having similar core fluxes in all three filters, only F169M shows the presence of the halo. |
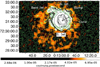 |
Fig. 5 Sketch of contoured Hα halo image illustrating interaction with ISM from Martin et al. (2002; dark contours) superposed on slightly smoothed FUV F169M image with green contours showing the FUV halo. We note the similarities between the images in the bent jet, the north jet (N. Jet), and the bump. |
Acknowledgments
We are very thankful and appreciative of the comments and suggestions made by an anonymous referee which helped us to improve the contents of the paper. UVIT and ASTROSAT observatory development took about two decades before launch. Several people from several agencies were involved in this effort. We would like to thank them all collectively. N.K.R. and S.K. would like to thank the Department of Science and Technology for their support through grant SERB/F/2143/2016-17 “Aspects in Stellar and Galactic Evolution”. A.R. would like to thank the Department of Atomic Energy, Govt. of India for a Raja Ramanna Fellowship. Some of the data presented in this paper were obtained from the Mikulski Archive for Space Telescopes (MAST). STScI is operated by the Association of Universities for Research in Astronomy, Inc.
References
- Bianchi, L. 1992, A&A, 253, 447 [NASA ADS] [Google Scholar]
- Bianchi, L., & Grewing, M. 1987, A&A, 181, 85 [NASA ADS] [Google Scholar]
- Clegg, R. E. S., Seaton, M. J., Peimbert, M., & Torres-Peimbert, S. 1983, MNRAS, 205, 417 [NASA ADS] [CrossRef] [Google Scholar]
- Corradi, R. L. M., Sánchez-Blázquez, P., Mellema, G., Gianmanco, C., & Schwarz, H. E. 2004, A&A, 417, 637 [NASA ADS] [CrossRef] [EDP Sciences] [Google Scholar]
- Feibelman, W. A. 1999, ApJ, 514, 296 [NASA ADS] [CrossRef] [Google Scholar]
- France, K., Andersson, B.-G., McCandliss, S. R., & Feldman, P. D. 2005, ApJ, 628, 750 [NASA ADS] [CrossRef] [Google Scholar]
- Herald, J. E., & Bianchi, L. 2004, ApJ, 611, 294 [NASA ADS] [CrossRef] [Google Scholar]
- Herald, J. E., & Bianchi, L. 2007, ApJ, 661, 845 [NASA ADS] [CrossRef] [Google Scholar]
- Herald, J. E., & Bianchi, L. 2011, MNRAS, 417, 2440 [NASA ADS] [CrossRef] [Google Scholar]
- Hora, J. L., Latter, W. B., & Deutsch, L. K. 1999, ApJS, 124, 195 [NASA ADS] [CrossRef] [Google Scholar]
- Kumar, A., Ghosh, S. K., Hutchings, J., et al. 2012, in Space Telescopes and Instrumentation 2012: Ultraviolet to Gamma Ray, Proc. SPIE, 8443, 84431N [CrossRef] [Google Scholar]
- Lang, D., Hogg, D. W., Mierle, K., Blanton, M., & Roweis, S. 2010, AJ, 139, 1782 [Google Scholar]
- Marcolino, W. L. F., Hillier, D. J., de Araujo, F. X., & Pereira, C. B. 2007, ApJ, 654, 1068 [NASA ADS] [CrossRef] [Google Scholar]
- Martin, C., Hurwitz, M., & Bowyer, S. 1990, ApJ, 354, 220 [NASA ADS] [CrossRef] [Google Scholar]
- Martin, D. C., Seibert, M., Neill, J. D., et al. 2007, Nature, 448, 790 [Google Scholar]
- Martin, J., Xilouris, K., & Soker, N. 2002, A&A, 391, 689 [NASA ADS] [CrossRef] [EDP Sciences] [Google Scholar]
- McCandliss, S.R., France, K., Lupu, R. E., et al. 2007, ApJ, 659, 1291 [NASA ADS] [CrossRef] [Google Scholar]
- Meaburn, J., Lopez, J., Bryce, M., & Mellema, G. 1996, A&A, 307, 579 [NASA ADS] [Google Scholar]
- Monteiro, H., & Falceta-Gonçalves, D. 2011, ApJ, 738, 174 [NASA ADS] [CrossRef] [Google Scholar]
- Montez, R., Jr., Kastner, J. H., Marco, O. D., & Soker, N. 2005, ApJ, 635, 381 [NASA ADS] [CrossRef] [Google Scholar]
- Murthy, J., Rahna, P., Sutaria, F., et al. 2017, Astron. Comput., 20, 120 [CrossRef] [Google Scholar]
- Pottasch, S. R., Bernard-Salas, J., Beintema, D. A., & Feibelman, W. A. 2003, A&A, 409, 599 [NASA ADS] [CrossRef] [EDP Sciences] [Google Scholar]
- Rahna, P. T., Murthy, J., Safonova, M., et al. 2017, MNRAS, 471, 3028 [NASA ADS] [CrossRef] [Google Scholar]
- Ramos-Larios, G., Phillips, J. P., & Cuesta, L. C. 2011, MNRAS, 411, 1245 [NASA ADS] [CrossRef] [Google Scholar]
- Sanchez, E., Montez, R., Jr., Ramstedt, S., & Stassun, K. G. 2015, ApJ, 798, L39 [NASA ADS] [CrossRef] [Google Scholar]
- Tandon, S. N., Hutchings, J. B., Ghosh, S. K., et al. 2017a, JApA, 38, 28 [NASA ADS] [Google Scholar]
- Tandon, S. N., Subramaniam, A., Girish, V., et al. 2017b, AJ, 154, 128 [NASA ADS] [CrossRef] [Google Scholar]
- Wareing, C. J., Zijlstra, A. A., & O’Brien, T. J. 2007, MNRAS, 382, 1233 [NASA ADS] [CrossRef] [Google Scholar]
- Witt, A. N., Stecher, T. P., Boroson, T. A., & Bohlin, R. C. 1989, ApJ, 336, L21 [NASA ADS] [CrossRef] [Google Scholar]
- Zhang, Y., & Liu, X.-W. 2005, ApJ, 631, L61 [NASA ADS] [CrossRef] [Google Scholar]
All Figures
|
Fig. 1 IUE low-resolution nebular spectrum of NGC 40 (blue line) obtained at 6″ north and 13″ west of the central star. FUV and NUV are plotted at the top and bottom, respectively, with UVIT-filter effective areas (relative) shown. In the top panel, green denotes F169M FUV Sapphire and magenta denotes F172M FUV Silica, and in the bottom panel, green is N219M NUV B15 and magenta is N279N NUV N2. |
| In the text | |
|
Fig. 2 Comparison of Galex images of NGC 40 with UVIT images. We note that the UVIT images provide better resolution and show structure in the nebula. The core of NGC 40 in F169M FUV Sapphire (top middle) is compared with N219M NUV B15 that shows mainly C II 2326 Å emission. C II image is very similar to low-excitation nebular line emissions seen in [S II] or [N II] (Meaburn et al. 1996) whereas F169M image shows several bright nebular condensations (also see Fig. 3). The axes are α and δ. |
| In the text | |
|
Fig. 3 X-ray image (left panel – blue emissions) superposed on Hα image is compared with the contoured F169M FUV Sapphire image (right panel). We note the similarities of the bright condensations of emission in both images and the overall elliptical shape. |
| In the text | |
|
Fig. 4 Cross-cuts in the images of the nebula in three filters; F169M (blue), F172M (green), and N219M (red) made along the white lines shown in the slightly smoothed F169M image of the nebula (top). Cross-cuts of 8 pixel widths were obtained in all the images at the same locations (coordinates). The bottom cross-cut, which passes through the nebular core, is on a logarithmic scale and has been smoothed. We note the faint quasi-circular extended halo around the core of the nebula (on the south-east side). This region has been shown with a grey overlay in the plots. Despite having similar core fluxes in all three filters, only F169M shows the presence of the halo. |
| In the text | |
|
Fig. 5 Sketch of contoured Hα halo image illustrating interaction with ISM from Martin et al. (2002; dark contours) superposed on slightly smoothed FUV F169M image with green contours showing the FUV halo. We note the similarities between the images in the bent jet, the north jet (N. Jet), and the bump. |
| In the text | |
Current usage metrics show cumulative count of Article Views (full-text article views including HTML views, PDF and ePub downloads, according to the available data) and Abstracts Views on Vision4Press platform.
Data correspond to usage on the plateform after 2015. The current usage metrics is available 48-96 hours after online publication and is updated daily on week days.
Initial download of the metrics may take a while.