Fig. 2
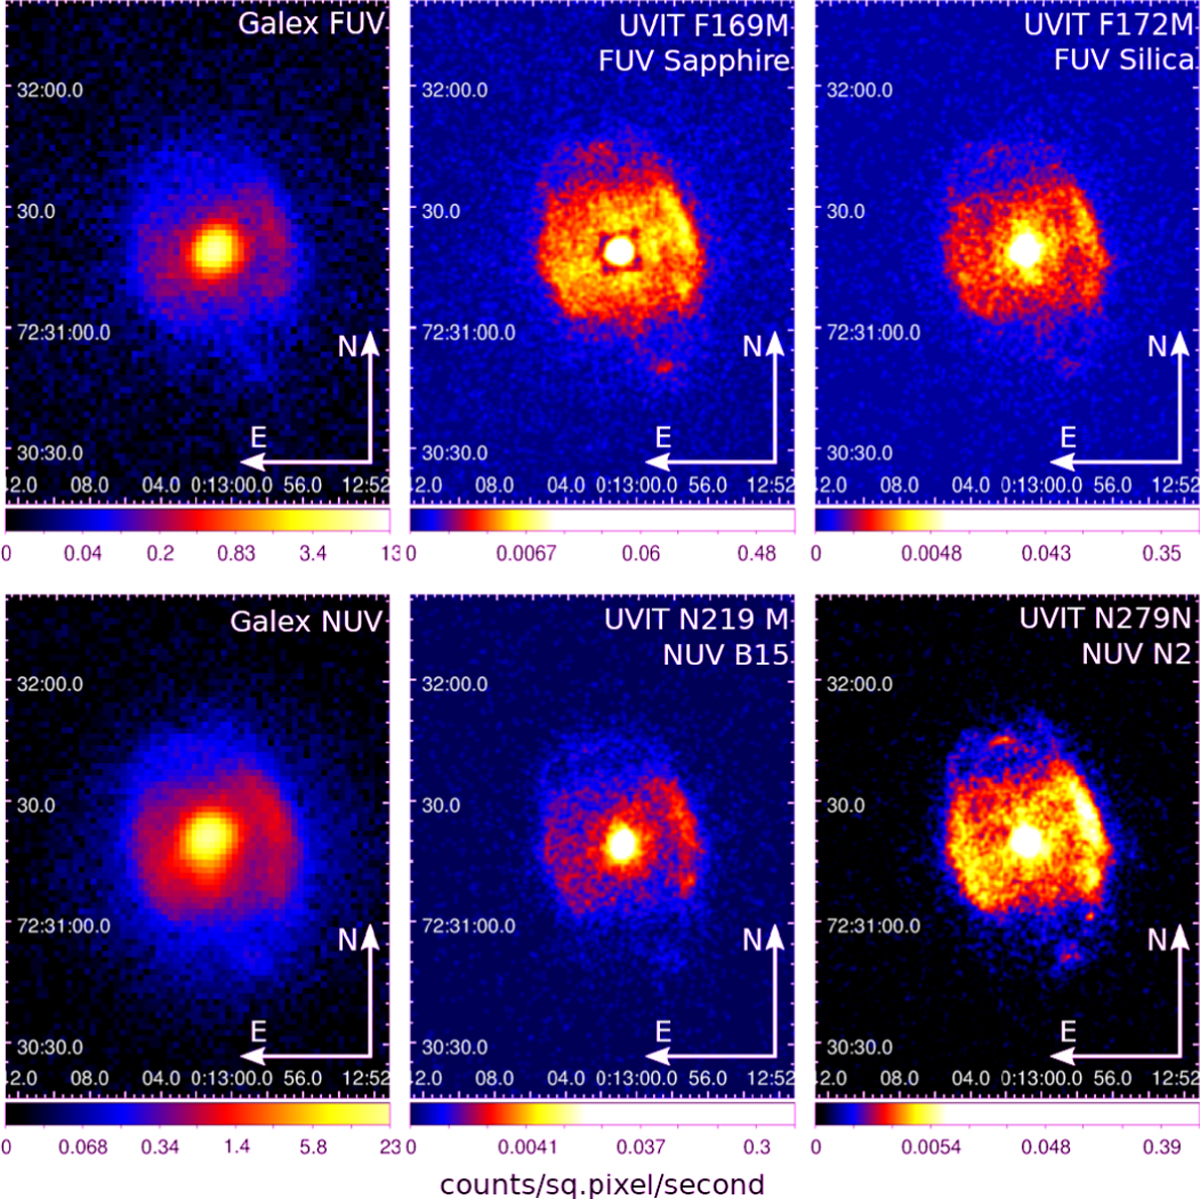
Comparison of Galex images of NGC 40 with UVIT images. We note that the UVIT images provide better resolution and show structure in the nebula. The core of NGC 40 in F169M FUV Sapphire (top middle) is compared with N219M NUV B15 that shows mainly C II 2326 Å emission. C II image is very similar to low-excitation nebular line emissions seen in [S II] or [N II] (Meaburn et al. 1996) whereas F169M image shows several bright nebular condensations (also see Fig. 3). The axes are α and δ.
Current usage metrics show cumulative count of Article Views (full-text article views including HTML views, PDF and ePub downloads, according to the available data) and Abstracts Views on Vision4Press platform.
Data correspond to usage on the plateform after 2015. The current usage metrics is available 48-96 hours after online publication and is updated daily on week days.
Initial download of the metrics may take a while.