| Issue |
A&A
Volume 609, January 2018
|
|
|---|---|---|
| Article Number | A19 | |
| Number of page(s) | 8 | |
| Section | Celestial mechanics and astrometry | |
| DOI | https://doi.org/10.1051/0004-6361/201732006 | |
| Published online | 22 December 2017 | |
Possible systematics in the VLBI catalogs as seen from Gaia
School of Astronomy and Space Sciences, Key Laboratory of Modern Astronomy and Astrophysics (Ministry of Education), Nanjing University, 163 Xianlin Street, 210023 Nanjing, PR China
e-mail: This email address is being protected from spambots. You need JavaScript enabled to view it.
Received: 27 September 2017
Accepted: 15 November 2017
Abstract
Aims. In order to investigate the systematic errors in the very long baseline interferometry (VLBI) positions of extragalactic sources (quasars) and the global differences between Gaia and VLBI catalogs, we use the first data release of Gaia (Gaia DR1) quasar positions as the reference and study the positional offsets of the second realization of the International Celestial Reference Frame (ICRF2) and the Goddard VLBI solution 2016a (gsf2016a) catalogs.
Methods. We select a sample of 1032 common sources among three catalogs and adopt two methods to represent the systematics: considering the differential orientation (offset) and declination bias; analyzing with the vector spherical harmonics (VSH) functions.
Results. Between two VLBI catalogs and Gaia DR1, we find that: i) the estimated orientation is consistent with the alignment accuracy of Gaia DR1 to ICRF, of ~0.1 mas, but the southern and northern hemispheres show opposite orientations; ii) the declination bias in the southern hemisphere between Gaia DR1 and ICRF2 is estimated to be +152 μas, much larger than that between Gaia DR1 and gsf2016a which is +34 μas. Between two VLBI catalogs, we find that: i) the rotation component shows that ICRF2 and gsf2016a are generally consistent within 30 μas; ii) the glide component and quadrupole component report two declination-dependent offsets: dipolar deformation of ~+50 μas along the Z-axis, and quadrupolar deformation of ~−50 μas that would induce a pattern of sin2δ.
Conclusions. The significant declination bias between Gaia DR1 and ICRF2 catalogs reported in previous studies is possibly attributed to the systematic errors of ICRF2 in the southern hemisphere. The global differences between ICRF2 and gsf2016a catalogs imply that possible, mainly declination-dependent systematics exit in the VLBI positions and need further investigations in the future Gaia data release and the next generation of ICRF.
Key words: astrometry / reference systems / catalogs
© ESO, 2017
1. Introduction
The International Celestial Reference Frame (ICRF) has been serving as the basic position reference for nearly three decades as it provides a very precise position observed by the very long baseline interferometry (VLBI) technique. The first generation of ICRF (ICRF1) was proposed in 1998 (Ma et al. 1998). With significant improvements, the second generation of ICRF (ICRF2; Fey et al. 2015) has been adopted since 2009 and now is widely used in astrometry and geodesy. The positional noise floor of ICRF2 is about 40 micro-arcseconds (μas) and the directional stability of the frame axes is at the level of 10 μas. The next generation of ICRF (ICRF3) is expected to be published in 2018 (Jacobs et al. 2014).
The monitoring and maintenance of the ICRF have been undertaken in previous works, for example, Gontier et al. (2001), Feissel-Vernier et al. (2006), Sokolova & Malkin (2007), Lambert (2014). These works usually involve comparison of the radio source positions provided in the regular VLBI solutions from different International VLBI Service (IVS) analysis centers. Lambert (2013) assessed the axis stability of ICRF2 to be of 20 μas and reported that there has been no noticeable deformation in ICRF2 since 2009. Similar results are presented in Lambert (2014) showing that almost all catalogs from different IVS analysis centers are consistent with respect to ICRF2 within 20 μas, except some catalogs showing significant orientation angles of ~40 μas. These works showed that the VLBI catalogs were generally consistent within several tens of μas.
In principle, the mutual comparison of VLBI solutions can only offer an internal check because these solutions are usually obtained at the same period, based on almost the same data and similar astrometric and geophysical models, thus cannot be rigorously considered independent. The more reasonable way is to adopt another catalog as the reference that is fully independent of VLBI observations and provide positions for sufficient radio sources with accuracy better than or at least comparable to VLBI. However, almost all the astrometric catalogs could not satisfy the requirements, until the Gaia mission published its first data release (Gaia DR1; Gaia Collaboration 2016a), which provides positions for about 135 000 known quasars.
The comparison in Mignard et al. (2016) showed large residuals and a declination bias ~0.1 mas between the Gaia DR1 and ICRF2 catalogs. The authors mentioned that the latter is likely due to the (ecliptic) north-south asymmetry of the systematics of Gaia observations. Considering that the ICRF2 catalog created in 2009 is already outdated for current VLBI observations (Malkin 2016), it is natural to include a new VLBI catalog to replace the ICRF2 catalog. Mignard & Klioner (2017) presented results showing that Gaia DR1 positions had less scattered residuals with respect to gsf2016a than to ICRF2 and showed no bias in the declination or right ascension relative to the VLBI catalog at XKa bands, which confirmed the quality of the Gaia DR1 catalog. The authors, therefore, concluded that large residuals between Gaia DR1 and ICRF2 catalogs reported in Mignard et al. (2016) were mainly attributed to systematics in ICRF2. Jacobs (2017) also compared the Gaia DR1 quasar positions with the VLBI positions obtained from VLBI observations at different wavelengths, that is, SX, K, and XKa bands. The authors reported that with respect to Gaia DR1, VLBI positions showed a smaller scatter and lower percentage outliers at higher radio frequency, which again confirmed the quality of the Gaia DR1 and implied possible systematics in the ICRF2. Generally, the comparisons between the Gaia DR1 and VLBI catalogs revealed some possible systematics in the ICRF2 catalog, which are not found in previous works based on the mutual comparison of VLBI catalogs. This motivates us to perform further investigations on this problem.
In this work, we aim to study systematics in the VLBI catalogs and the global differences between Gaia and VLBI quasar positions. Three catalogs are used for comparison: the Gaia DR1 auxiliary quasar solution, the ICRF2 catalog, and the gsf2016a serving as the prototype of ICRF3. In contrast to previous works where the ICRF2 was used as the reference catalog, we use the Gaia DR1 quasar positions as the reference.
2. Dataset
Gsf2016a is a VLBI solution based on all available dual band VLBI observations at 8.4 GHz and 2.2 GHz from 1979.08.03 to 2016.08.22, except these of the VLBA Calibrator Surveys (VCS)1. As a result, this solution does not contain most of the VCS-only sources that are usually observed in only one session. Gsf2016a provides global source positions of 1895 sources and mean positions of 39 ICRF2 “special handling sources”, the latter being known as unstable sources. To avoid the effect of variations of individual source positions due to the intrinsic source-structure changes such as jets, we only used 1895 sources whose positions were estimated as global parameters in the VLBI solutions. For the Gaia DR1 auxiliary quasar solution, there are only 2191 ICRF2 source counterparts in the optical band. We selected a sample consisting of all 1032 common sources among these three catalogs and five groups are investigated for comparison: all the 1032 sources denoted as “All”; 563 sources in the northern hemisphere and 469 in the south, denoted as “North” and “South”, respectively; 262 sources among the 295 ICRF2 defining sources and 770 non-defining sources, denoted as “Defining” and “Non-def”, respectively. The median positional errors of the sample in Gaia DR1, ICRF2, and gsf2016a are 590 μas, 134 μas, and 62 μas for the right ascension component (α ∗ cosδ); 528 μas, 200 μas, and 88 μas for the declination component.
Figure 1 plots the positions for all 1032 sources used in this work. Some sparse regions can be seen between −60° and −30°, leading to an uneven sky distribution. Figure 2 shows the zonal mean of positional differences of ICRF2 and gsf2016a catalogs with respect to the Gaia DR1. Large mean offsets in the VLBI and Gaia positions (up to 5 mas) are clearly visible, which again motivates us to carry out further analyses.
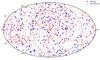 |
Fig. 1 Distribution of 1032 quasars used in this work, including 262 ICRF2 defining sources (blue solid circles) and 770 non-defining sources (red crosses). |
3. Representations of the systematics
The global difference between radio source positions in two catalogs can be written as a coordinate transformation; the most commonly used one considers a simple orientation: ![Mathematical equation: \begin{eqnarray} \label{eq:rotation} \Delta\alpha ^* & =& -A_1\cos\alpha\sin\delta - A_2\sin\alpha\sin\delta + A_3\cos\delta, \nonumber\\[2mm] \Delta\delta & =& +A_1\sin\alpha - A_2\cos\alpha, \end{eqnarray}](/articles/aa/full_html/2018/01/aa32006-17/aa32006-17-eq16.png) (1)where Δα∗ = Δαcosδ; A1, A2, and A3 are orientation angles around the X, Y, and Z axes, respectively. This transformation is usually used to align the reference frames, for example, to align the Gaia DR1 reference frame to ICRF2 (Lindegren et al. 2016), or to assess the stability of reference frame axes (e.g., Lambert 2013). If we consider a possible declination bias as done, for instance, in Feissel-Vernier et al. (2006), an additional term dz (known as equatorial tilt) should be added to Eq. (1):
(1)where Δα∗ = Δαcosδ; A1, A2, and A3 are orientation angles around the X, Y, and Z axes, respectively. This transformation is usually used to align the reference frames, for example, to align the Gaia DR1 reference frame to ICRF2 (Lindegren et al. 2016), or to assess the stability of reference frame axes (e.g., Lambert 2013). If we consider a possible declination bias as done, for instance, in Feissel-Vernier et al. (2006), an additional term dz (known as equatorial tilt) should be added to Eq. (1): ![Mathematical equation: \begin{eqnarray} \label{eq:rotation_dz} \Delta\alpha ^* & =& - A_1\cos\alpha\sin\delta - A_2\sin\alpha\sin\delta + A_3\cos\delta,\nonumber \\[2mm] \Delta\delta & =& + A_1\sin\alpha - A_2\cos\alpha + \mathrm{d}z. \end{eqnarray}](/articles/aa/full_html/2018/01/aa32006-17/aa32006-17-eq24.png) (2)Here we used this term dz to check if there is an overall declination offset between Gaia DR1 and VLBI positions as mentioned in Mignard et al. (2016) and figure out the cause.
(2)Here we used this term dz to check if there is an overall declination offset between Gaia DR1 and VLBI positions as mentioned in Mignard et al. (2016) and figure out the cause.
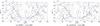 |
Fig. 2 Mean differences between Gaia DR1 and VLBI positions calculated in each cell of 10° × 10°. To obtain a better visual effect, the sources with position difference larger than 5 mas are not plotted. The blue line indicates the Galactic plane and two red crosses indicate directions of the Galactic center and the anti-Galactic center. |
A more general way to represent the global difference between catalogs is to use the vector spherical harmonics (VSH; Mignard & Klioner 2012). Mignard & Klioner (2012) provided detailed mathematical descriptions and practical examples for the VSH analysis. This method is similar to the Fourier expansions which help us to see more details as the highest degree lmax increases. Nevertheless, the VSH analysis of higher orders adds more parameters to estimate, and hence would make the estimation biased for a small sample. Also, there is no physical interpretation available for terms with lmax> 2. Hence only the first two degrees VSH functions were considered in this work. For the first degree, the magnetic (or toroidal) and electric (or spheroidal) harmonics can be denoted as a rotation vector R = (R1,R2,R3)T and a glide vector G = (G1,G2,G3)T, respectively, and the induced vector field can be described as follows: ![Mathematical equation: \begin{eqnarray} \label{eq:VSH_deg1} \Delta\alpha^* &=& - R_1\cos\alpha\sin\delta - R_2\sin\alpha\sin\delta + R_3\cos\delta \nonumber\\[2mm] && \quad- G_1\sin\alpha + G_2\cos\alpha, \nonumber\\[2mm] \Delta\delta &=& + R_1\sin\alpha - R_2\cos\alpha \nonumber\\[2mm] && \quad- G_1\cos\alpha\sin\delta - G_2\sin\alpha\sin\delta + G_3\cos\delta. \end{eqnarray}](/articles/aa/full_html/2018/01/aa32006-17/aa32006-17-eq31.png) (3)The rotation vector R is equivalent to orientation angles in Eqs. (1) and (2). For the second degree, the quadrupolar vector field can be described as follows (Titov & Lambert 2013):
(3)The rotation vector R is equivalent to orientation angles in Eqs. (1) and (2). For the second degree, the quadrupolar vector field can be described as follows (Titov & Lambert 2013): ![Mathematical equation: \begin{eqnarray} \Delta\alpha^* &=& + M_{2,0}\sin 2\delta \nonumber\\ && \quad - \cos 2\delta~(M_{2,1}^{\rm Re}\cos \alpha - M_{2,1}^{\rm Im}\sin \alpha)\nonumber \\[2mm] && \quad + \sin \delta~(E_{2,1}^{\rm Re}\sin \alpha + E_{2,1}^{\rm Im}\cos \alpha) \nonumber\\[2mm] && \quad - \sin 2\delta~(M_{2,2}^{\rm Re}\cos 2\alpha - M_{2,2}^{\rm Im}\sin 2\alpha) \nonumber\\[2mm] && \quad - 2\cos \delta~(E_{2,2}^{\rm Re}\sin 2\alpha + E_{2,2}^{\rm Im}\cos 2\alpha),\nonumber \\[2mm] \Delta\delta &=& + E_{2,0}\sin 2\delta \nonumber\\ && \quad - \sin \delta~(M_{2,1}^{\rm Re}\sin \alpha + M_{2,1}^{\rm Im}\cos \alpha)\nonumber \\[2mm] && \quad - \cos 2\delta~(E_{2,1}^{\rm Re}\cos \alpha - E_{2,1}^{\rm Im}\sin \alpha)\nonumber \\[2mm] && \quad + 2\cos \delta~(M_{2,2}^{\rm Re}\sin 2\alpha + M_{2,2}^{\rm Im}\cos 2\alpha)\nonumber \\[2mm] && \quad - \sin 2\delta~(E_{2,2}^{\rm Re}\cos 2\alpha - E_{2,2}^{\rm Im}\sin 2\alpha), \label{eq:VSH_deg2} \end{eqnarray}](/articles/aa/full_html/2018/01/aa32006-17/aa32006-17-eq33.png) (4)where E and M stand for the VSH functions of electric and magnetic types, respectively.
(4)where E and M stand for the VSH functions of electric and magnetic types, respectively.
In the following analysis, all of the unknowns were estimated by the weighted least squares method. Except for the formal errors of source positions, the covariance information between right ascension and declination of each source was also considered. The data were weighted using the approach introduced in Mignard et al. (2016, see Eq. (4) and Appendix B), that is, the covariance matrix between Δα∗ and Δδ in the least squares fitting is given by ![Mathematical equation: \begin{equation} \label{eq:covariance_matrix} \Sigma = \begin{bmatrix} \sigma_{\alpha^*,G}^2 + \sigma_{\alpha^*,{\rm V}}^2 & c_G + c_{\rm V} \\[2mm] c_G + c_{\rm V} & \sigma_{\delta,G}^2 + \sigma_{\delta,{\rm V}}^2 \end{bmatrix}, \end{equation}](/articles/aa/full_html/2018/01/aa32006-17/aa32006-17-eq38.png) (5)where
(5)where  and
and  are the formal errors of right ascension and declination in the Gaia DR1 catalog;
  and
and  are the formal errors of right ascension and declination given in VLBI catalogs; and cG and cV are the covariances between right ascension and declination of each source given in Gaia DR1 and VLBI catalogs, respectively. The 3-sigma principle was adopted to remove the outliers.
4. Investigating the systematics
4.1. Consideration of the differential orientation.
Differential orientation between Gaia DR1 and VLBI catalogs. Atot is obtained by 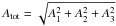 .
.
Differential orientation and declination bias between Gaia DR1 and VLBI catalogs.
The differential orientations between Gaia DR1 and VLBI catalogs are presented in Table 1. Referring to Gaia DR1, the ICRF2 catalog showed a total orientation of 62 ~ 207μas; for gsf2016a it was from 54 μas to 188 μas. This result is quite normal since the Gaia DR1 reference frame is aligned to the ICRF with an accuracy of about 0.1 mas at the epoch J2015.0 (Lindegren et al. 2016). Comparing the three orientation angles of the ICRF2 catalog (upper part) with those of gsf2016a (lower part), the differences never exceed 20 μas, except for A2 of the group “South” which is about 50 μas. This result is consistent with that in Lambert (2013) and Lambert (2014), that is, the axis stability of ICRF2 is on the order of 20 μas. Comparing the results of different groups in the same catalog, however, some inconsistencies are presented. For the ICRF2 catalog, the relative orientation angles for groups “North” and “South” have opposite signs, as found in Liu et al. (2017). Using the new gsf2016a data, we attained similar results, indicating that there are possible zonal deformations between VLBI and Gaia DR1 catalogs.
When we considered the additional declination bias dz, the orientation angles A1 and A2 changed slightly, in the same order as their uncertainties, and A3 remained almost unchanged for both ICRF2 and gsf2016a catalogs (Table 2) compared with Table 1. This means that estimating dz did not significantly affect the estimation of orientation angles. Table 3 shows that the correlation coefficients between dz and three orientation angles in the solutions in Table 2 never exceed 0.3. From the column dz in Table 2, one can clearly find a significant bias in both ICRF2 and gsf2016a catalogs. The bias was estimated to be of 78 ~ 152μas between ICRF2 and Gaia DR1 catalogs, which agrees with the declination bias of about −0.1 mas as reported in Mignard et al. (2016) and later confirmed in our previous work (Liu et al. 2017). For gsf2016a, dz was estimated to be smaller in comparison, strictly beneath 100 μas for all five groups, especially for the “Defining” group which yielded zero bias.
Then we compared the bias dz obtained from the ICRF2 catalog with that from gsf2016a. Taking gsf2016a minus ICRF2 in sense, the differences were −74 ± 18 μas for “All” group; −32 ± 25 μas and −118 ± 29 μas for “North” and “South” group, respectively; and −78 ± 30 μas and −75 ± 24 μas for “Defining” and “Non-def”, respectively. The groups “All”, “Defining”, and “Non-def” gave consistent results: there was a relative declination offset of 70 μas between gsf2016a and ICRF2 catalogs. Comparing directly the declination of the two catalogs for the 290 common ICRF2 defining sources, a clear offset can be seen in Fig. 3, mostly in the southern hemisphere. The declination offset between gsf2016a and ICRF2 catalogs is obviously beyond the precision of ICRF2, which was not found in the previous works. A lot of effort has been made to strengthen the southern hemisphere after the adoption of ICRF2 (Jacobs et al. 2014), therefore we can reasonably consider gsf2016a as an improved catalog compared to ICRF2 in the southern hemisphere. As a result, the declination offset between gsf2016a and ICRF2 catalogs should reflect the systematic errors of ICRF2 in the southern hemisphere. We thus concluded that the declination offset of about 0.1 mas between Gaia DR1 and ICRF2 positions would be mostly coming from the position errors of ICRF2 catalog rather than Gaia DR1. Furthermore, the pattern in Fig. 3 is more similar to sin2δ than linear or a bias. In the following section, we also use the VSH tools to directly investigate this pattern.
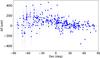 |
Fig. 3 Declination differences between gsf2016a and ICRF2 catalogs for 290 common ICRF2 defining sources, in the sense of ICRF2 minus gsf2016a. A clear positive offset can be seen from the south side of the equator. |
4.2. Analysis with the VSH tools.
Rotation component of VSH analysis of Gaia DR1 and VLBI positional offsets.
Glide component of VSH analysis for the Gaia DR1 and VLBI positional offsets.
As stated in Mignard & Klioner (2012), the implementation of VSH functions requires the orthogonality conditions to be satisfied, which means that the sample should distribute uniformly on the celestial sphere. Therefore, the groups “North” and “South” which only contain radio sources in the half-sky were not analyzed with this method.
Table 4 reports the rotation component in the VSH analysis of the positional offsets among the Gaia DR1, ICRF2, and gsf2016a catalogs. For the first-degree VSH analysis (lmax = 1), the rotation components of the ICRF2 and gsf2016a catalogs with respect to the Gaia DR1 were consistent within their formal errors. Comparing directly the positions between the ICRF2 and gsf2016a catalogs, we found the largest component of rotation vector R2 to be 20 ~ 30 μas. This result is similar to those of Tables 1 and 2, indicating that the ICRF2 and gsf2016a are consistent within several tens of μas when considering only the rotation vector.
Table 5 reports the glide component in the VSH analysis of the positional offsets among the Gaia DR1, ICRF2, and gsf2016a catalogs. For lmax = 1, the glide component was on the order of 100 μas both for ICRF2 and gsf2016a catalogs referring to Gaia DR1, slightly larger than that in Mignard et al. (2016). Theoretically, part of the observed glide component between Gaia DR1 and VLBI catalogs is supposed to be the accumulative Galactic aberration effect over the J 2000.0 ~ J 2015.0 period caused by the Solar acceleration relative to the Galactic Center (see, e.g., Malkin 2016). The Galactic aberration would induce a dipolar proper motion for quasars and cause a time-dependent orientation between ICRF and Gaia reference frames. Assuming the Galactic aberration constant to be 5 μas yr-1, the amplitude of the glide induced by the Galactic aberration is supposed to be of 75 μas and pointed to the anti-Galactic center (we take VLBI minus Gaia in sense). The obtained glide, however, was 2−4 times as large and the direction of glide vector was far away from the Galactic center and anti-Galactic center (last column in Table 5). Moreover, the glide obtained from different groups in the same catalog did not give consistent results in terms of the amplitude and the direction. Consequently, the obtained glide vector was interpreted as the dipolar deformation between Gaia and VLBI positions.
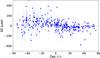 |
Fig. 4 Declination residuals for 290 ICRF2 defining sources after the adjustment of the first-degree VSH functions based on the solution of the group “Defining”, in sense of ICRF2 minus gsf2016a. The large positive offsets in the southern hemisphere in Fig. 3 are reduced but still show a sin2δ -like pattern. |
The positional offset between ICRF2 and gsf2016a catalogs showed a glide larger than 50 μas, mainly directed along the Z-axis. Since G3 only appears in the expression of Δδ (Eq. (3)), it can therefore only partly explain the declination bias of ~100 μas seen in Fig. 3. Figure 4 shows the declination residuals for 290 common ICRF2 defining sources after the adjustment of parameters in the first-degree VSH fitting using the “Defining” group. One can see that large positive offsets in the southern hemisphere in Fig. 3 are reduced, but still a pattern that looks like a sin2δ can be found.
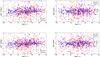 |
Fig. 5 Residual plot after adjustment of the first two-degree VSH for the group “All”. Top left: the right ascension component of “ICRF2 −Gaia DR1”. Top right: the declination component of “ICRF2 −Gaia DR1”. Bottom left: the right ascension component of “gsf2016a −Gaia DR1”. Bottom right: the declination component of “gsf2016a −Gaia DR1”. Symbols show defining sources as blue circles and non-defining sources as red crosses. |
The analysis of the first-two-degree VSH (lmax = 2) gave relatively consistent rotation and glide vectors with that of lmax = 1 regarding their formal errors. Between Gaia DR1 and two VLBI catalogs, the quadrupole terms gave the consistent result and were estimated to be of the same order as rotation and glide, that is, of ~100 μas. Based on the same catalogs, different groups gave inconsistent results, especially for the “Defining” group which showed a quadrupole component  as large as ~300 μas. Figure 5 plots the residual of adjustment of the parameters in the VSH analysis of lmax = 2 using the “All” group. The pre-fit weighted rms of Δα∗ and Δδ are 1365 μas and 1588 μas for ICRF2 minus Gaia DR1; and 1522 μas and 2148 μas for gsf2016a minus Gaia DR1. Performing the VSH analysis of the first degree, the post-fit weighted rms of Δα∗ and Δδ are 1357 μas and 1578 μas for ICRF2 minus Gaia DR1; and 1516 μas and 2145 μas for gsf2016a minus Gaia DR1. After the VSH analysis of the first two degrees, the post-fit weighted rms of Δα∗ and Δδ are 1355 μas and 1574 μas for ICRF2 minus Gaia DR1; and 1514 μas and 2140 μas for gsf2016a minus Gaia DR1. As a result, the VSH fittings improved the positional offset between Gaia DR1 and VLBI catalogs; however, this improvement is insignificant compared to the positional offset.
Between ICRF2 and gsf2016a catalogs, we found a significant quadrupole term E2,0 relative to the formal error, which would cause a pattern of sin2δ in the declination offset. Figure 6 plots the declination residuals for 290 common ICRF2 defining sources after the adjustment of parameters in the first-two-degree VSH fitting using the “Defining” group. We found that the patterns seen in Fig. 3 were clearly removed. The weighted rms of declination offsets in Figs. 3, 4, and 6 are 101 μas, 64 μas, and 64 μas, respectively. We, therefore, concluded that there are two, mainly deformation terms of ~50 μas between ICRF2 and gsf2016a, leading to the declination offsets between these two VLBI catalogs.
Table 6 displays the correlation coefficients between parameters in the VSH fittings, from which one could find several correlation coefficients larger than 0.4, for example, between G2 and  . This indicates that estimating quadrupole terms would affect the determination of rotation and glide components; although the estimated rotation and glide are roughly consistent for lmax = 1 and lmax = 2. Comparing Eq. (3) with Eq. (4), we can easily find that G2 and have the same coefficient (−cosαsinδ) in the declination component. Things are similar between G1 and
  , R1 and
  , and R2 and
  . Probably, these similarities in cofficients (elements of the Jacobian matrix) make the simultaneous estimation of these parameters more sensitive to the number of sources and their distribution in the sky. We thus used all 2191 common sources between ICRF2 and Gaia DR1 and performed the VSH fittings. The results were consistent with those in Tables 4, 5 and 7 but the correlation coefficient between G2 and reduced down to 0.5, although it still showed a strong correlation. These strong correlations, therefore, are possibly because the sample did not distribute uniformly in the sky (some sparse areas can be seen in Fig. 2). In this case, the requirement of orthogonality conditions for VSH analysis was not satisfied.
5. Concluding remarks
We analyzed the global position difference between ICRF2 and gsf2016a catalogs referring to the Gaia DR1 auxiliary solution. Some inconsistencies between ICRF2 and gsf2016a catalogs are found, together with possible deformations taking place between Gaia DR1 and the two VLBI catalogs.
The orientation angles of ICRF2 and gsf2016a catalogs relative to Gaia DR1 agree well with the claimed alignment accuracy of Gaia DR1 reference frame to ICRF2. The opposite orientation between the groups “North” and “South”, presented both in ICRF2 and gsf2016a catalogs, indicates possible deformations taking place between VLBI and Gaia DR1 catalogs. If we consider that the Gaia DR1 represents a rigid frame due to the well-designed principle of Gaia astrometric observations, there would be possible North-South deformations in the VLBI catalogs. The declination bias of ~0.1 mas between Gaia DR1 and ICRF2 reported in Mignard et al. (2016) is found to be most probably caused by the source position errors in the southern hemisphere of ICRF2. Direct comparison of ICRF2 and gsf2016a declinations reveals some declination-dependent patterns; however, these patterns are not like a bias or linear.
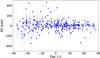 |
Fig. 6 Declination residuals for 290 ICRF2 defining sources after the adjustment of the first two-degree VSH functions based on the solution of the group “Defining”, in sense of ICRF2 minus gsf2016a. The patterns seen in Fig. 3 are clearly removed. |
The VSH analysis indicates that there are some other systematics between Gaia DR1 and the two VLBI catalogs, causing a dipolar deformation on the order of 100 μas. Besides, the positional offsets of ICRF2 defining sources yield a large quadrupole term of 300 μas, which is significant regarding the accuracy of Gaia DR1 and VLBI catalogs and thus requires a careful check. The VSH analysis of the positional offsets between ICRF2 and gsf2016a gives an interesting result. On the one hand, the rotation component shows that these two VLBI catalogs are generally consistent within 30 μas. On the other hand, the glide component and quadrupole component report two declination-dependent deformations in the declination offsets: dipolar deformation along the Z-axis, and quadrupolar deformation that would induce a pattern of sin2δ. These two declination-dependent systematics are not found in previous works and should be explained clearly in ICRF3.
We note that the Gaia DR1 is the early stage of the whole Gaia mission and there are several shortcomings (Gaia Collaboration 2016b; Lindegren et al. 2016). As a result, using Gaia DR1 quasar positions as the reference would introduce some systematics in the final results. Furthermore, the uncertainties given in gsf2016a are the formal errors in the VLBI solution rather than the inflated error as in ICRF2, which means that the positional uncertainty in gsf2016a is underestimated. In view of future Gaia data releases and the next generation of ICRF, the global difference between Gaia and VLBI positions, as well as their own systematics, will be seen more clearly.
Quadrupole terms of VSH analysis of Gaia DR1 and VLBI positional offsets.
Detailed descriptions of gsf2016a can be found at http://gemini.gsfc.nasa.gov/solutions/2016a/2016a.html
Acknowledgments
The authors are very grateful to an anonymous referee for their constructive comments and useful suggestions, which helped to improve the paper. This research is funded by the National Natural Science Foundation of China (NSFC) under grant No. 11473013. This work has made use of data from the European Space Agency (ESA) mission Gaia (http://www.cosmos.esa.int/gaia), processed by the Gaia Data Processing and Analysis Consortium (DPAC, http://www.cosmos.esa.int/web/gaia/dpac/consortium). Funding for the DPAC has been provided by national institutions, in particular, the institutions participating in the Gaia Multilateral Agreement. This work has also used the VLBI global solution provided by Goddard Space Flight Center (GSFC) VLBI Analysis Center. L.N. also thanks Y.-T. Cao for his careful check of the language.
References
- Feissel-Vernier, M., Ma, C., Gontier, A.-M., & Barache, C. 2006, A&A, 452, 1107 [NASA ADS] [CrossRef] [EDP Sciences] [Google Scholar]
- Fey, A. L., Gordon, D., Jacobs, C. S., et al. 2015, AJ, 150, 58 [NASA ADS] [CrossRef] [Google Scholar]
- Gaia Collaboration (Prusti, T., et al.) 2016a, A&A, 595, A1 [NASA ADS] [CrossRef] [EDP Sciences] [Google Scholar]
- Gaia Collaboration (Brown, A. G. A., et al.) 2016b, A&A, 595, A2 [NASA ADS] [CrossRef] [EDP Sciences] [Google Scholar]
- Gontier, A.-M., Le Bail, K., Feissel, M., & Eubanks, T. M. 2001, A&A, 375, 661 [Google Scholar]
- Jacobs, C. S. 2017, Astrometry & Astrophysics in the Gaia Sky, IAU Symp., 330 [Google Scholar]
- Jacobs, C., Arias, F., Boboltz, D., et al. 2014, in Journées 2013 “Systèmes de référence spatio-temporels”, ed. N. Capitaine, 51 [Google Scholar]
- Lambert, S. 2013, A&A, 553, A122 [NASA ADS] [CrossRef] [EDP Sciences] [Google Scholar]
- Lambert, S. 2014, A&A, 570, A108 [NASA ADS] [CrossRef] [EDP Sciences] [Google Scholar]
- Lindegren, L., Lammers, U., Bastian, U., et al. 2016, A&A, 595, A4 [NASA ADS] [CrossRef] [EDP Sciences] [Google Scholar]
- Liu, N., Zhu, Z., Liu, J.-C., & Ding, C.-Y. 2017, A&A, 599, A140 [NASA ADS] [CrossRef] [EDP Sciences] [Google Scholar]
- Ma, C., Arias, E. F., Eubanks, T. M., et al. 1998, AJ, 116, 516 [NASA ADS] [CrossRef] [Google Scholar]
- Malkin, Z. 2016, Frontiers in Astronomy and Space Sciences, 3, 28 [NASA ADS] [CrossRef] [Google Scholar]
- Mignard, F., & Klioner, S. 2012, A&A, 547, A59 [NASA ADS] [CrossRef] [EDP Sciences] [Google Scholar]
- Mignard, F., & Klioner, S. 2017, Astrometry & Astrophysics in the Gaia Sky, IAU Symp., 330 [Google Scholar]
- Mignard, F., Klioner, S., Lindegren, L., et al. 2016, A&A, 595, A5 [NASA ADS] [CrossRef] [EDP Sciences] [Google Scholar]
- Sokolova, J., & Malkin, Z. 2007, A&A, 474, 665 [NASA ADS] [CrossRef] [EDP Sciences] [Google Scholar]
- Titov, O., & Lambert, S. 2013, A&A, 559, A95 [NASA ADS] [CrossRef] [EDP Sciences] [Google Scholar]
All Tables
Differential orientation between Gaia DR1 and VLBI catalogs. Atot is obtained by .
Differential orientation and declination bias between Gaia DR1 and VLBI catalogs.
All Figures
|
Fig. 1 Distribution of 1032 quasars used in this work, including 262 ICRF2 defining sources (blue solid circles) and 770 non-defining sources (red crosses). |
| In the text | |
|
Fig. 2 Mean differences between Gaia DR1 and VLBI positions calculated in each cell of 10° × 10°. To obtain a better visual effect, the sources with position difference larger than 5 mas are not plotted. The blue line indicates the Galactic plane and two red crosses indicate directions of the Galactic center and the anti-Galactic center. |
| In the text | |
|
Fig. 3 Declination differences between gsf2016a and ICRF2 catalogs for 290 common ICRF2 defining sources, in the sense of ICRF2 minus gsf2016a. A clear positive offset can be seen from the south side of the equator. |
| In the text | |
|
Fig. 4 Declination residuals for 290 ICRF2 defining sources after the adjustment of the first-degree VSH functions based on the solution of the group “Defining”, in sense of ICRF2 minus gsf2016a. The large positive offsets in the southern hemisphere in Fig. 3 are reduced but still show a sin2δ -like pattern. |
| In the text | |
|
Fig. 5 Residual plot after adjustment of the first two-degree VSH for the group “All”. Top left: the right ascension component of “ICRF2 −Gaia DR1”. Top right: the declination component of “ICRF2 −Gaia DR1”. Bottom left: the right ascension component of “gsf2016a −Gaia DR1”. Bottom right: the declination component of “gsf2016a −Gaia DR1”. Symbols show defining sources as blue circles and non-defining sources as red crosses. |
| In the text | |
|
Fig. 6 Declination residuals for 290 ICRF2 defining sources after the adjustment of the first two-degree VSH functions based on the solution of the group “Defining”, in sense of ICRF2 minus gsf2016a. The patterns seen in Fig. 3 are clearly removed. |
| In the text | |
Current usage metrics show cumulative count of Article Views (full-text article views including HTML views, PDF and ePub downloads, according to the available data) and Abstracts Views on Vision4Press platform.
Data correspond to usage on the plateform after 2015. The current usage metrics is available 48-96 hours after online publication and is updated daily on week days.
Initial download of the metrics may take a while.