Fig. 2
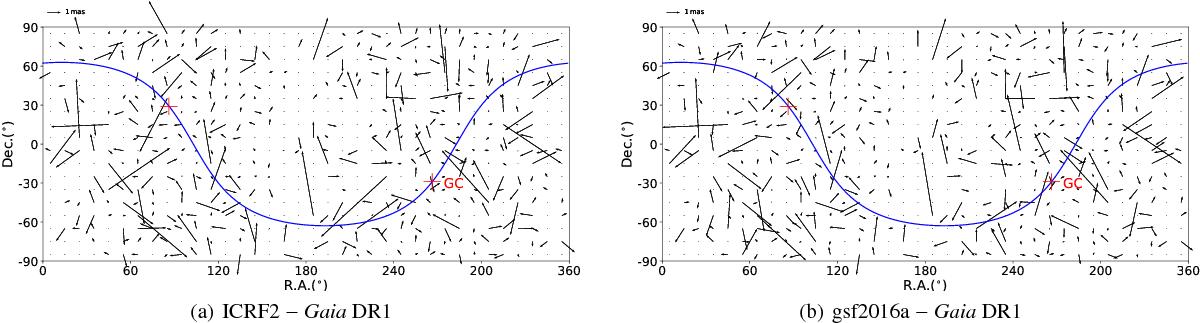
Mean differences between Gaia DR1 and VLBI positions calculated in each cell of 10° × 10°. To obtain a better visual effect, the sources with position difference larger than 5 mas are not plotted. The blue line indicates the Galactic plane and two red crosses indicate directions of the Galactic center and the anti-Galactic center.
Current usage metrics show cumulative count of Article Views (full-text article views including HTML views, PDF and ePub downloads, according to the available data) and Abstracts Views on Vision4Press platform.
Data correspond to usage on the plateform after 2015. The current usage metrics is available 48-96 hours after online publication and is updated daily on week days.
Initial download of the metrics may take a while.