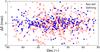
Fig. 5
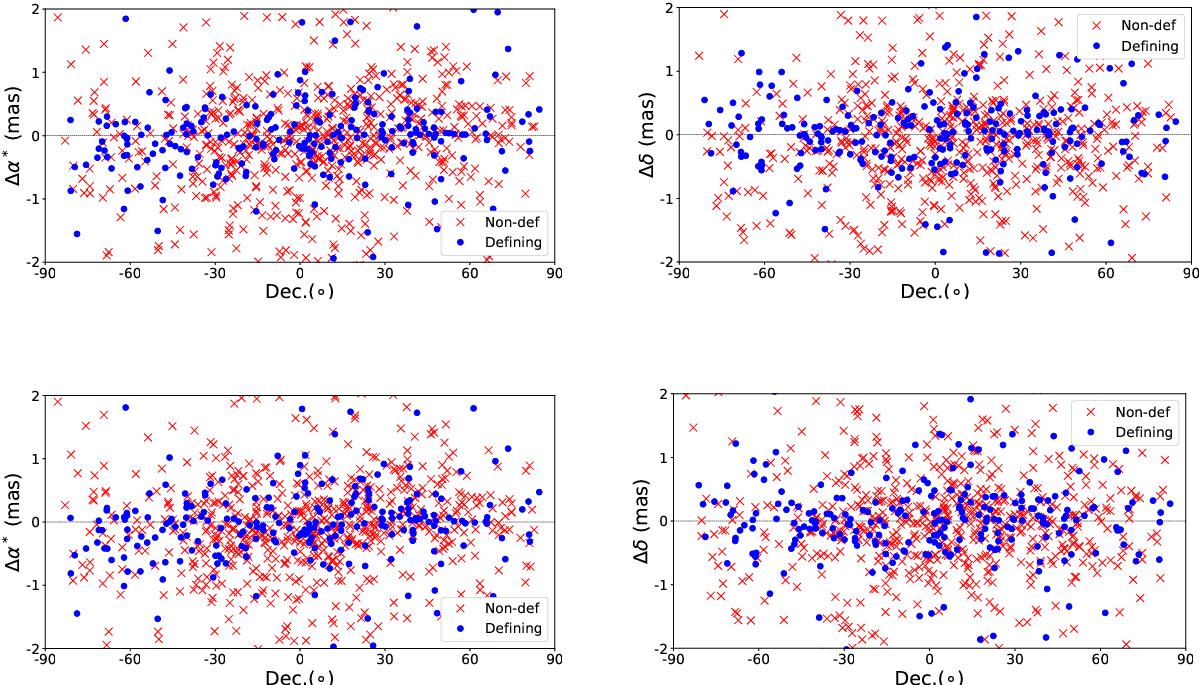
Residual plot after adjustment of the first two-degree VSH for the group “All”. Top left: the right ascension component of “ICRF2 −Gaia DR1”. Top right: the declination component of “ICRF2 −Gaia DR1”. Bottom left: the right ascension component of “gsf2016a −Gaia DR1”. Bottom right: the declination component of “gsf2016a −Gaia DR1”. Symbols show defining sources as blue circles and non-defining sources as red crosses.
Current usage metrics show cumulative count of Article Views (full-text article views including HTML views, PDF and ePub downloads, according to the available data) and Abstracts Views on Vision4Press platform.
Data correspond to usage on the plateform after 2015. The current usage metrics is available 48-96 hours after online publication and is updated daily on week days.
Initial download of the metrics may take a while.