Fig. 1
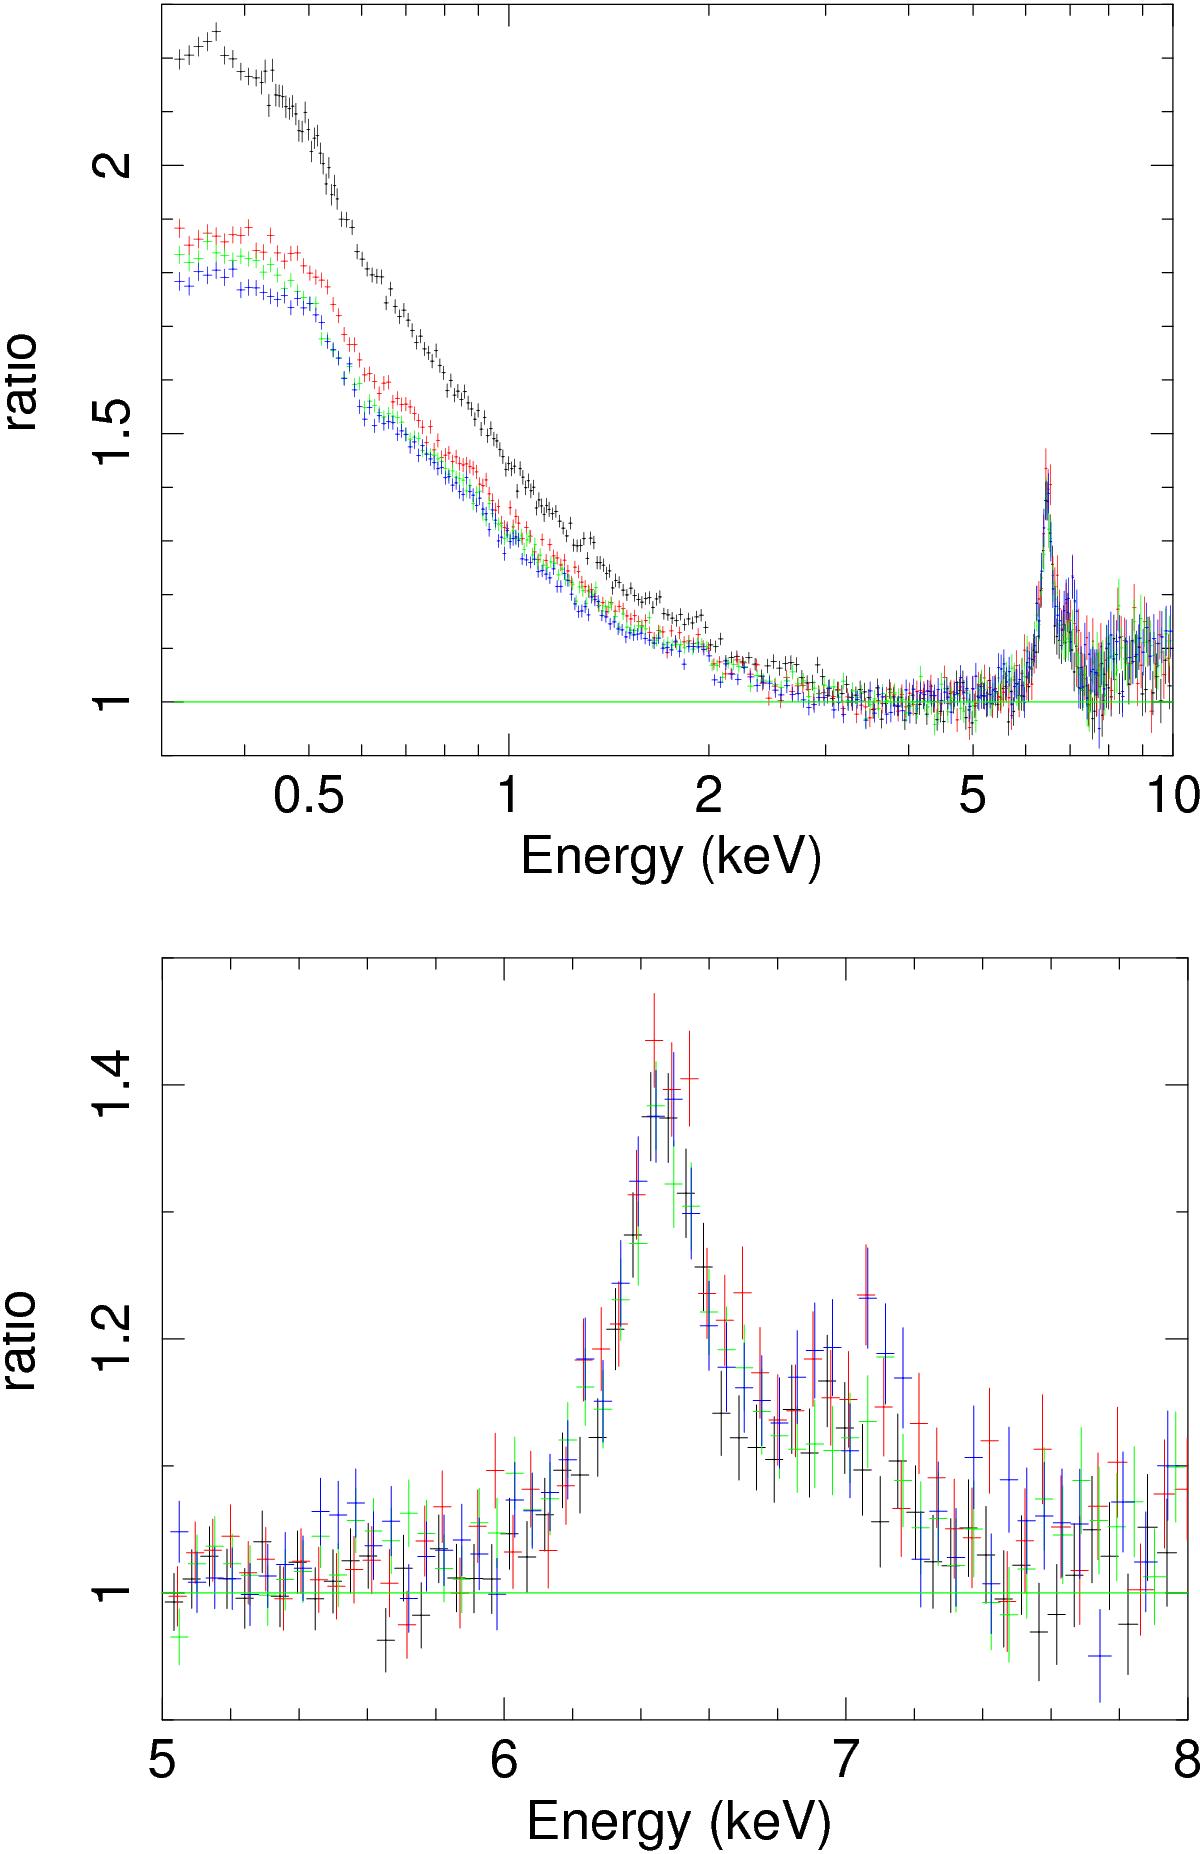
Data/model ratio of the four 2014 XMM-Newton/pn spectra of Ark 120 fitted with a Galactic absorbed power-law continuum model over the 3–5 keV energy range, and then extrapolated over the 0.3–10 keV energy range. Black: March 18, red: March 20, green: March 22, and blue: March 24. Top panel: 0.3–10 keV energy range. Bottom panel: zoom on the Fe Kα complex.
Current usage metrics show cumulative count of Article Views (full-text article views including HTML views, PDF and ePub downloads, according to the available data) and Abstracts Views on Vision4Press platform.
Data correspond to usage on the plateform after 2015. The current usage metrics is available 48-96 hours after online publication and is updated daily on week days.
Initial download of the metrics may take a while.