Fig. 2
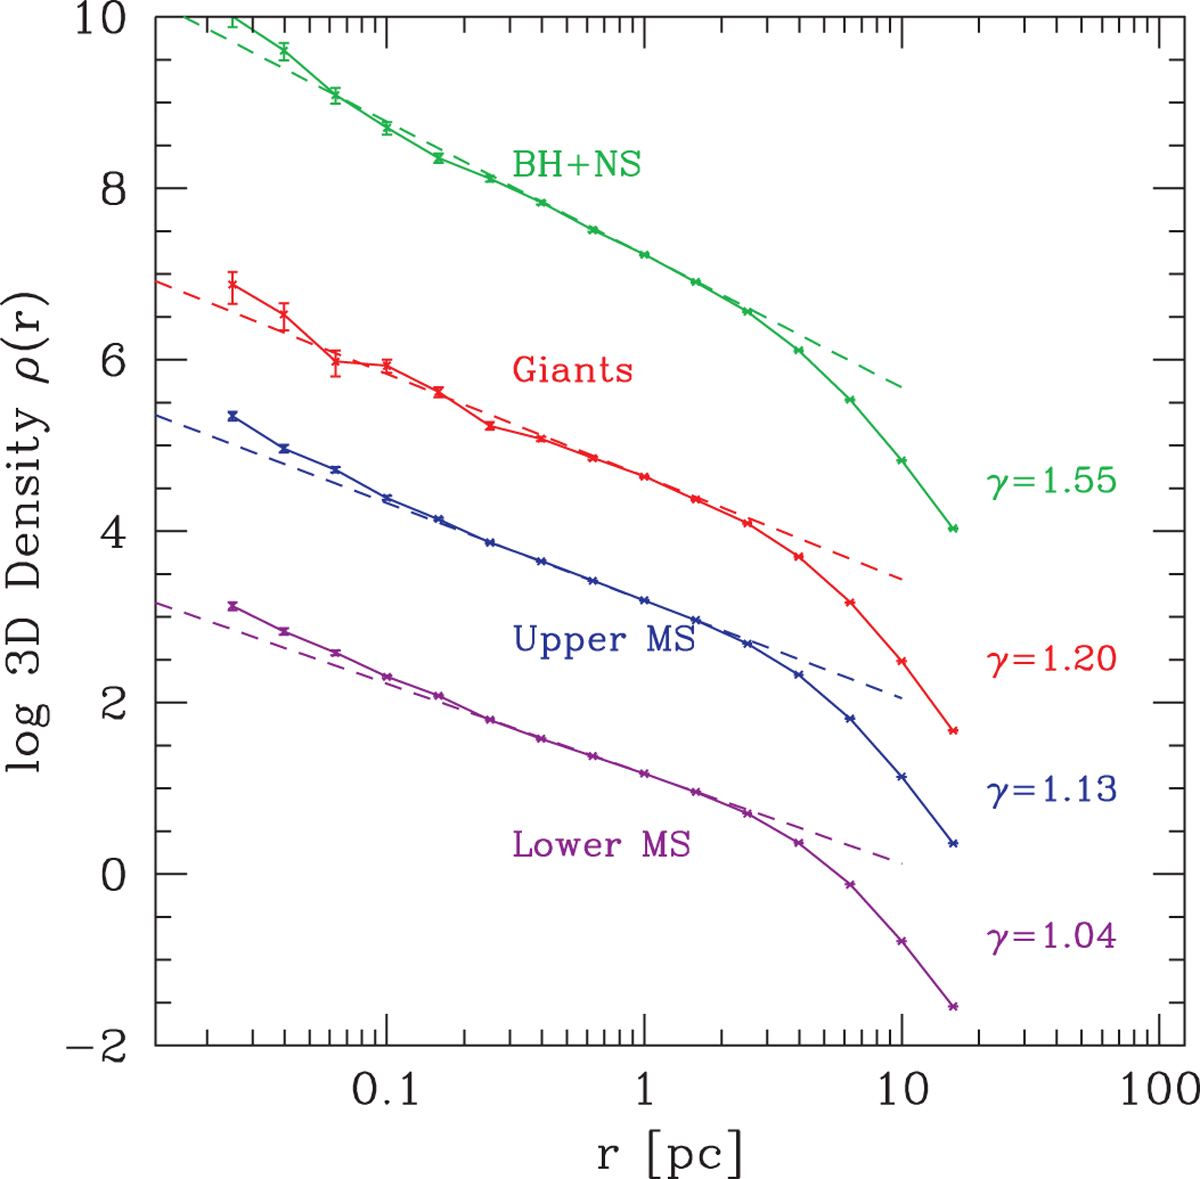
Spatial density of different stellar components at the end ofour simulations. From top to bottom, we show the density distribution of black holes and neutron stars (green), giant stars with apparent magnitudes KS < 18.5 (red), upper main-sequence stars with masses 0.6 and 0.8 M⊙ (blue), and low-mass main-sequence stars with masses 0.1 and 0.3 M⊙ (orange). For clarity, curves are shifted vertically. Dashed lines show power-law density distributions ρ (r) ~ rγ fitted to the density distribution inside the influence radius of the black hole (rBH = 2.8 pc). Because of mass segregation, the slope steepens from γ = 1.04 for the lowest-mass main-sequence stars to γ = 1.55 for black holes.
Current usage metrics show cumulative count of Article Views (full-text article views including HTML views, PDF and ePub downloads, according to the available data) and Abstracts Views on Vision4Press platform.
Data correspond to usage on the plateform after 2015. The current usage metrics is available 48-96 hours after online publication and is updated daily on week days.
Initial download of the metrics may take a while.