Fig. 6
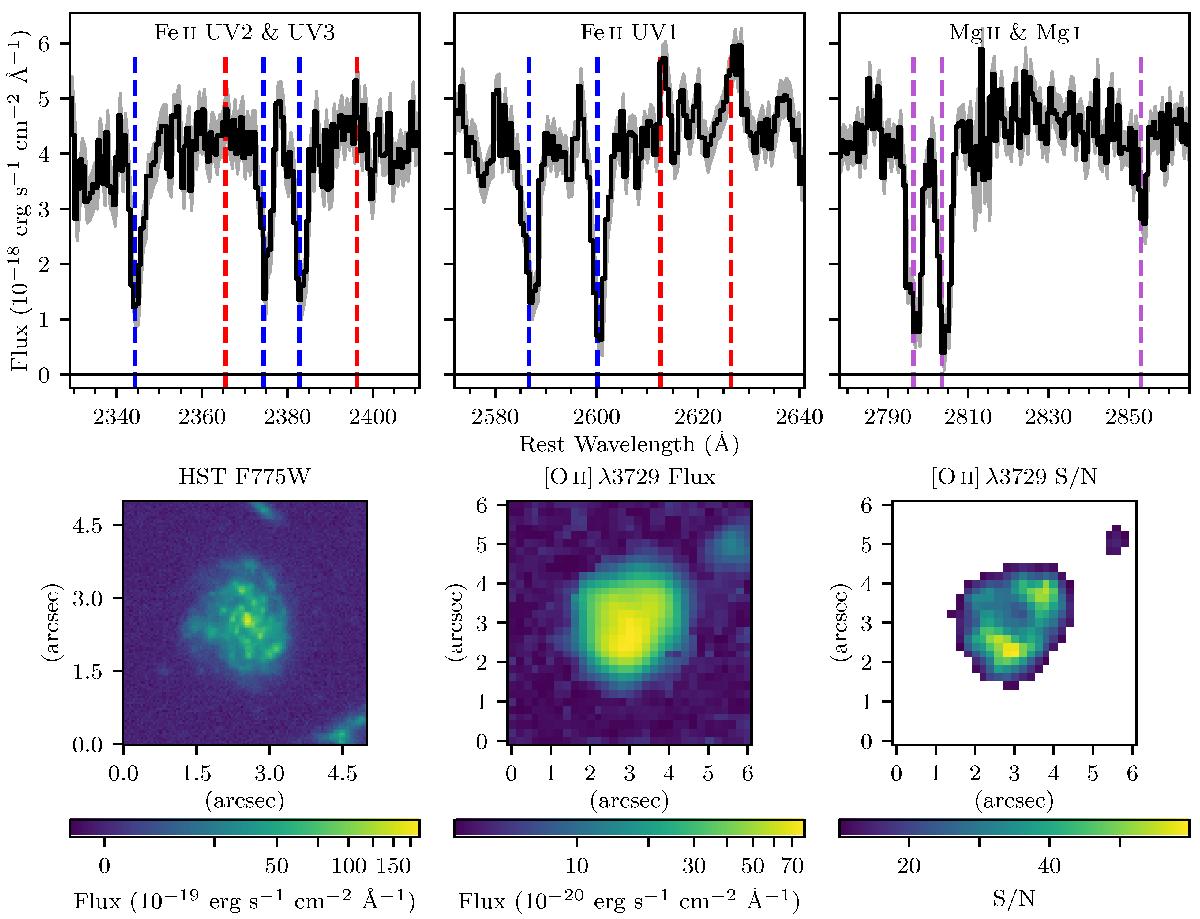
UDF Galaxy ID 8 at z = 1.0948. Top row: sections of the MUSE spectrum with the UV2 and UV3 Fe ii multiplets (Fe ii λ2344, Fe ii*λ2365, Fe ii λλ2374,2382 and Fe ii*λ2396), the UV1 Fe ii multiplet (Fe ii λλ2586,2600 and Fe ii*λ2612,2626), and Mg ii λλ2796,2803 with Mg i λ2852. The blue (purple) dashed lines indicate the resonant Fe ii (Mg ii) transitions, and the red dashed lines show the non-resonant Fe ii* emission. Bottom row: HST F775W image and the MUSE [O ii] λ3729 flux map with an asinh scale, along with the corresponding MUSE S/N map with a threshold of S/N> 10. This galaxy is large and face-on. The spectrum shows Fe ii, Mg ii, and Mg i absorption features, with Fe ii* emission.
Current usage metrics show cumulative count of Article Views (full-text article views including HTML views, PDF and ePub downloads, according to the available data) and Abstracts Views on Vision4Press platform.
Data correspond to usage on the plateform after 2015. The current usage metrics is available 48-96 hours after online publication and is updated daily on week days.
Initial download of the metrics may take a while.