Fig. 4
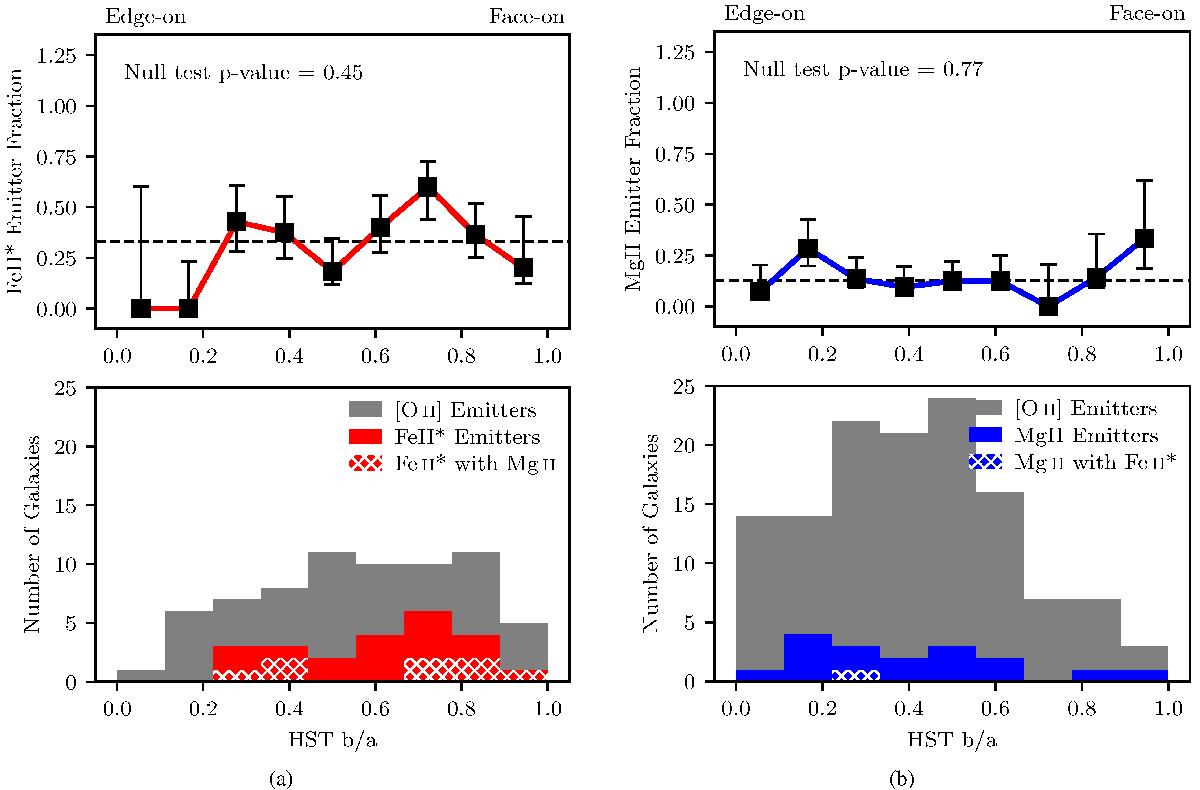
Column a: bottom: axis ratio (b/a) distribution for the Fe ii* emitters from the HST Y-band. The grey histogram shows the distribution for 69 [O ii] emitters with SFR ≥ + 0.5 M⊙ yr-1, and the red histogram shows the subpopulation of Fe ii* emitters with confidence flag qc> 1 (23 galaxies). White hatching indicates Fe ii* emitters within this SFR range that also have Mg ii emission or P Cygni profiles (8 galaxies). Top: the fraction of Fe ii* emitters for the nine axis ratio bins. Error bars represent the 68% confidence interval as in Fig 1. Column b: bottom: axis ratio (b/a) distribution for the Mg ii emitters from the HST Y-band. The grey histogram shows the distribution for 133 [O ii] emitters with −0.5 M⊙ yr-1≤ SFR ≤ + 0.5 M⊙ yr-1, and the blue histogram shows the subpopulation of Mg ii emitters with confidence flag qc> 1 (17 galaxies). White hatching indicates Mg ii emitters within this SFR range that also have Fe ii* emission (1 galaxy). Top: the fraction of Mg ii emitters for the nine axis ratio bins.
Current usage metrics show cumulative count of Article Views (full-text article views including HTML views, PDF and ePub downloads, according to the available data) and Abstracts Views on Vision4Press platform.
Data correspond to usage on the plateform after 2015. The current usage metrics is available 48-96 hours after online publication and is updated daily on week days.
Initial download of the metrics may take a while.