Fig. 3
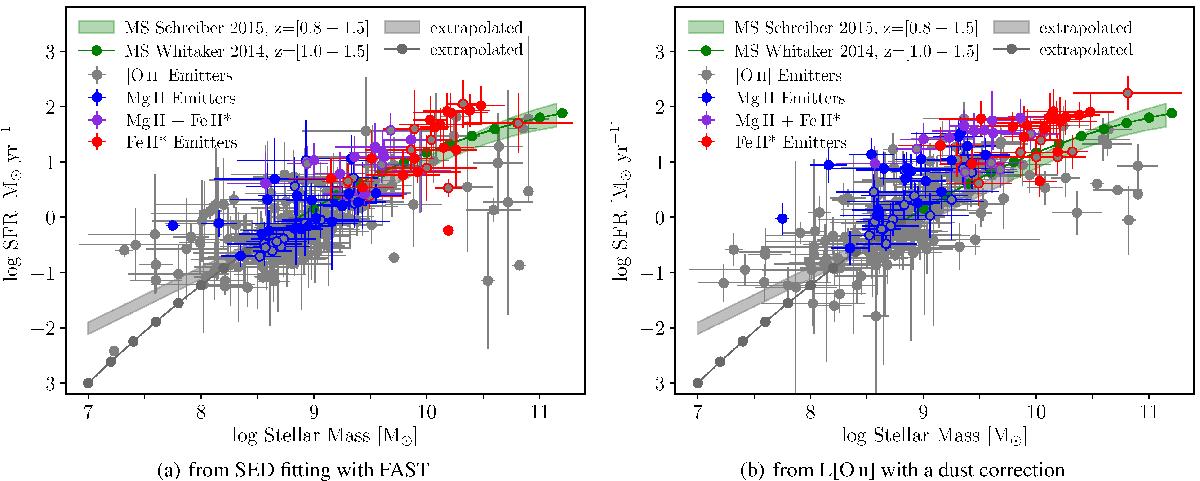
Panel a: SFR–M⋆sequence for the 271 galaxies in our redshift range, (0.85 <z< 1.50), using SFR values from SED fitting. Panel b: SFR–M⋆sequence for the same galaxy sample using SFR values from L[O ii] fluxes with a dust correction following Kewley et al. (2004). In both panels, galaxies with only Fe ii* emission (only Mg ii emission or P Cygni profiles) are shown in red (blue). Galaxies with both Fe ii* emission and Mg ii emission or P Cygni profiles are shown in purple. Filled colored points indicate secure detections with qc> 1, and points with colored outlines indicate qc = 1 detections. The green filled region represents the main sequence in our redshift range determined by Schreiber et al. (2015) using a mass complete sample of 60 000 galaxies from the GOODS-Herschel and CANDELS-Herschel programs. The grey filled region represents the main sequence from Schreiber et al. (2015) extrapolated below their mass completeness. The green (grey) solid line with circular points represents the main sequence from Whitaker et al. (2014) over the redshift range z = [ 1.0−1.5 ] to M⋆= 109 M⊙ (extrapolated below their completeness), respectively.
Current usage metrics show cumulative count of Article Views (full-text article views including HTML views, PDF and ePub downloads, according to the available data) and Abstracts Views on Vision4Press platform.
Data correspond to usage on the plateform after 2015. The current usage metrics is available 48-96 hours after online publication and is updated daily on week days.
Initial download of the metrics may take a while.