Fig. 2
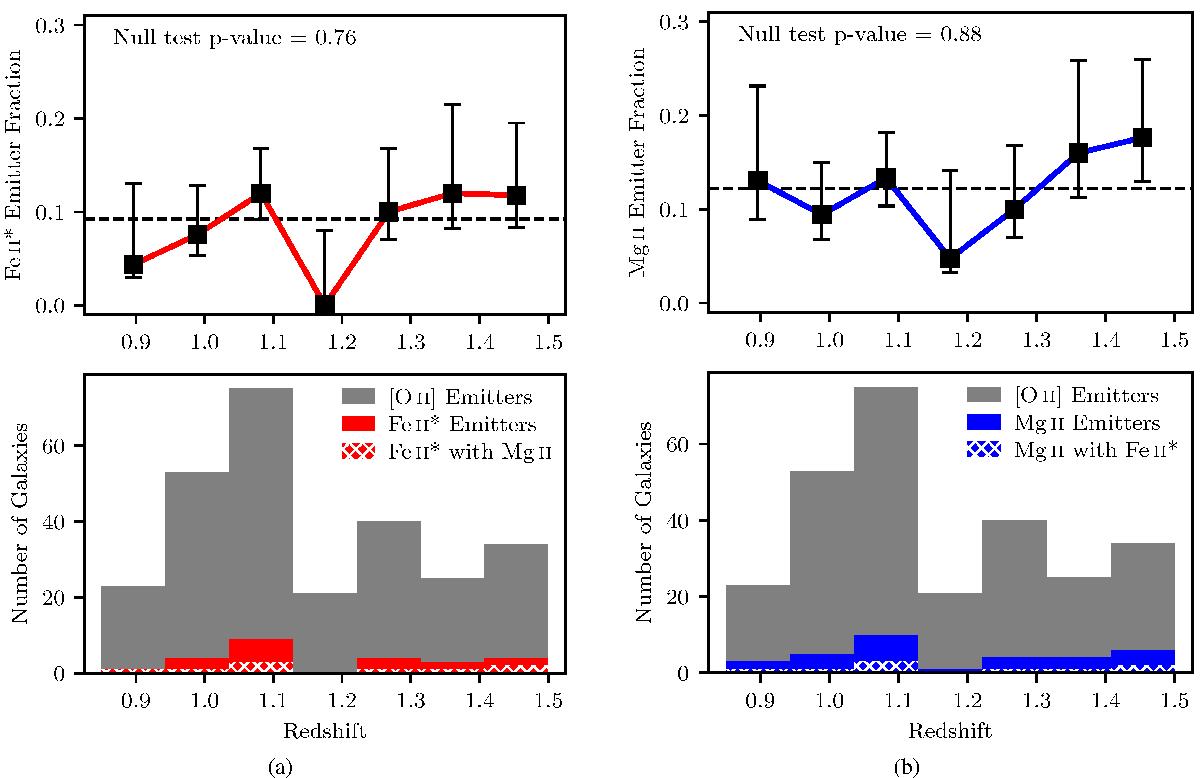
Column a: bottom: redshift distribution for the Fe ii* emitters. The grey histogram shows the distribution for the full sample of 271 [O ii] emitters in the redshift range 0.85 < z < 1.50 (271 galaxies), and the red histogram shows the subpopulation of Fe ii* emitters with confidence flag qc > 1 (25 galaxies). White hatching indicates Fe ii* emitters that also have Mg ii emission or P Cygni profiles (9 galaxies). Top: the fraction of Fe ii* emitters for the eight redshift bins. Error bars on these fractions represent 68% confidence levels using Beta distributions as in Cameron (2011). The Fe ii*-emitter fraction is about 10% globally and is also consistent with a uniform distribution. Column b: bottom: redshift distribution for the Mg ii emitters. The grey histogram again shows the distribution for the full sample of [O ii] emitter galaxies, and the blue histogram shows the subpopulation of Mg ii emitters with confidence flag qc > 1 (33 galaxies). White hatching indicates Mg ii emitters that also have Fe ii* emission (9 galaxies). Top: the fraction of Mg ii emitters for each redshift bin with 68% confidence intervals. The Mg ii-emitter fraction is about 12% globally and is also consistent with a uniform distribution.
Current usage metrics show cumulative count of Article Views (full-text article views including HTML views, PDF and ePub downloads, according to the available data) and Abstracts Views on Vision4Press platform.
Data correspond to usage on the plateform after 2015. The current usage metrics is available 48-96 hours after online publication and is updated daily on week days.
Initial download of the metrics may take a while.